Advanced predictions, data and plotting
NBNode can leverage its .data attribute for prediction and plotting.
Predict based on node names
Sometimes it might be usefull to identify the node corresponding to its name. Usually, try to set your name such that it matches NBNode.get_name_full(), but it might be of convenience.
[1]:
import nbnode.nbnode_trees as nbtree
mytree = nbtree.tree_simple()
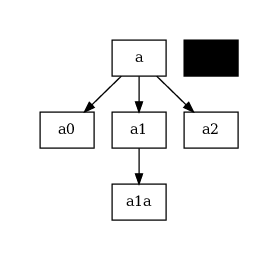
mytree.pretty_print()
print(mytree.prediction_str("/a"))
print(mytree.prediction_str("/a/a0"))
print(mytree.prediction_str("/a/a1"))
# In this case, probably better:
print(mytree["/a"])
print(mytree["/a/a0"])
print(mytree["/a/a1"])
# It becomes interesting when the splits are different or the root node is missing:
print(mytree.prediction_str("/a/a1/a1a"))
print(mytree["/a/a1/a1a"])
print("\nMissing root")
print(mytree.prediction_str("a/a1/a1a"))
print(mytree["a/a1/a1a"])
print("\nDifferent split")
print(mytree.prediction_str(":a:a1:a1a", split=":"))
print(mytree[":a:a1:a1a"])
a (counter:0)
├── a0 (counter:0)
├── a1 (counter:0)
│   └── a1a (counter:0)
└── a2 (counter:0)
NBNode('/a', counter=0, decision_name=None, decision_value=None)
NBNode('/a/a0', counter=0, decision_name='m1', decision_value=-1)
NBNode('/a/a1', counter=0, decision_name='m1', decision_value=1)
NBNode('/a', counter=0, decision_name=None, decision_value=None)
NBNode('/a/a0', counter=0, decision_name='m1', decision_value=-1)
NBNode('/a/a1', counter=0, decision_name='m1', decision_value=1)
NBNode('/a/a1/a1a', counter=0, decision_name='m2', decision_value='test')
NBNode('/a/a1/a1a', counter=0, decision_name='m2', decision_value='test')

Missing root
NBNode('/a/a1/a1a', counter=0, decision_name='m2', decision_value='test')
None

Different split
NBNode('/a/a1/a1a', counter=0, decision_name='m2', decision_value='test')
None
Usage of .data
The .data is quite powerfull for further predictions, math and plotting.
[2]:
import os
import re
import pandas as pd

print(os.getcwd())
cellmat = pd.read_csv(
    os.path.join(
        os.pardir, os.pardir, "tests", "testdata", "flowcytometry", "gated_cells", "cellmat.csv"
    )
)
# FS TOF (against FS INT which is "FS")
cellmat.rename(columns={"FS_TOF": "FS.0"}, inplace=True)
cellmat.columns = [re.sub("_.*", "", x) for x in cellmat.columns]
print(cellmat)
/home/gugl/clonedgit/ccc_verse/nbnode/docs/notebooks
         FS  FS.0      SS  CD45RA  CCR7  CD28   PD1  CD27   CD4   CD8   CD3
0    197657    94  186372    3.90  6.34  4.97 -1.98  7.51  5.87  3.55  5.83  \
1    180716    92  135447    6.48  6.63  5.17  3.07  7.38  5.49  2.64  5.83
2    134129    90  168268    5.92  6.53  5.39  2.60  7.57  5.70  2.54  5.74
3    239241    94   79262    5.47  6.57  4.68  3.30  7.36  5.75  2.76  6.06
4    246527    89   97635    6.12  6.26  5.22  3.05  7.40  5.70  2.66  6.29
..      ...   ...     ...     ...   ...   ...   ...   ...   ...   ...   ...
994  176236    90  149982    6.48 -1.11  2.85 -1.55  2.28  0.59  1.70  0.39
995  191863    99  115406    6.30  5.19  3.01  2.07 -1.58  0.62  1.02  0.73
996  217752    93  124675    6.35  4.75  0.42  1.89  2.02  0.52  1.48  0.53
997  334174    97  210458    1.90  1.36  1.22  2.52 -0.72  0.59  1.03  0.75
998  308089   103  219747    6.48 -0.42  1.23  2.64  7.07  0.57  1.82  1.72

     CD57  CD45
0    2.62  6.78
1    2.39  6.76
2    1.02  6.46
3    1.14  6.59
4    2.22  6.33
..    ...   ...
994  4.22  6.49
995  2.69  6.22
996  2.92  6.50
997  2.98  5.38
998  2.87  6.03

[999 rows x 13 columns]
[3]:
import nbnode.nbnode_trees as nbtree

cell_tree = nbtree.tree_complete_aligned_trunk()
cell_tree.data = cellmat
# When setting .data, we do not need to give the cellmat explicitely to .predict()
cell_tree.id_preds(cell_tree.predict())
cell_tree.count(use_ids=True)
cell_tree.pretty_print()
AllCells (counter:999)
├── DN (counter:0)
├── DP (counter:973)
├── CD4-/CD8+ (counter:5)
│   ├── naive (counter:5)
│   ├── Tcm (counter:0)
│   ├── Temra (counter:0)
│   └── Tem (counter:0)
└── CD4+/CD8- (counter:21)
    ├── naive (counter:20)
    ├── Tcm (counter:0)
    ├── Temra (counter:1)
    └── Tem (counter:0)
/home/gugl/.conda_envs/nbnode_pyscaffold/lib/python3.8/site-packages/nbnode/nbnode.py:353: UserWarning: self.ids was an empty list, subset an empty dataframe. Did you call celltree.id_preds(predicted_nodes)? Can also be a node with no cells.
  warnings.warn(
Accessing any node’s data is easy and is built on rootnode._data and node.ids such that every node.data := root._data.iloc[self.ids, :].
[4]:
print(cell_tree.data.iloc[0:3, :])
print(cell_tree.data.shape)


print(cell_tree["/AllCells/CD4+/CD8-"].data.iloc[0:3, :])
print(cell_tree["/AllCells/CD4+/CD8-"].data.shape)
       FS  FS.0      SS  CD45RA  CCR7  CD28   PD1  CD27   CD4   CD8   CD3
0  197657    94  186372    3.90  6.34  4.97 -1.98  7.51  5.87  3.55  5.83  \
1  180716    92  135447    6.48  6.63  5.17  3.07  7.38  5.49  2.64  5.83
2  134129    90  168268    5.92  6.53  5.39  2.60  7.57  5.70  2.54  5.74

   CD57  CD45
0  2.62  6.78
1  2.39  6.76
2  1.02  6.46
(999, 13)
        FS  FS.0      SS  CD45RA  CCR7  CD28   PD1  CD27   CD4   CD8   CD3
17  184334   107  210764    2.88  6.38  6.11  4.13  7.91  6.00 -2.65  6.15  \
25  173701   105  235028    1.81  5.53  6.40  3.83  7.28  6.01 -0.56  5.72
45  224976   101  162302    1.50  1.36  6.21  3.49  3.56  6.17 -3.40  5.37

    CD57  CD45
17  2.51  6.82
25  2.66  6.80
45  1.90  6.30
(21, 13)
Now we can use the data and apply a function to it. Using it directly returns a dictionary of every node and the applied function: Dict[NBNode, Any].
[5]:
# calculate the sum of all cells per column
def col_sum(df: pd.DataFrame):
    return df.apply(sum, axis=0)


# There are 13 nodes in that tree, therefore apply returns a DICTIONARY of 13 elements
print(len(cell_tree.apply(fun=col_sum)))
print("\n\n\n")
print(cell_tree.apply(fun=col_sum))
13


{NBNode('/AllCells', counter=999, decision_name=None, decision_value=None): FS        4.463310e+08
FS.0      1.077770e+05
SS        7.552312e+08
CD45RA    2.627850e+03
CCR7      2.423360e+03
CD28      2.544160e+03
PD1       2.563000e+03
CD27      2.087390e+03
CD4       1.559720e+03
CD8       2.202570e+03
CD3       1.274720e+03
CD57      3.276380e+03
CD45      5.539190e+03
dtype: float64, NBNode('/AllCells/DN', counter=0, decision_name=['CD4', 'CD8'], decision_value=[-1, -1]): FS        0
FS.0      0
SS        0
CD45RA    0
CCR7      0
CD28      0
PD1       0
CD27      0
CD4       0
CD8       0
CD3       0
CD57      0
CD45      0
dtype: int64, NBNode('/AllCells/DP', counter=973, decision_name=['CD4', 'CD8'], decision_value=[1, 1]): FS        4.381676e+08
FS.0      1.050100e+05
SS        7.451190e+08
CD45RA    2.549230e+03
CCR7      2.365810e+03
CD28      2.479180e+03
PD1       2.469230e+03
CD27      2.012120e+03
CD4       1.475720e+03
CD8       2.203020e+03
CD3       1.220460e+03
CD57      3.175190e+03
CD45      5.372880e+03
dtype: float64, NBNode('/AllCells/CD4-/CD8+', counter=5, decision_name=['CD4', 'CD8'], decision_value=[-1, 1]): FS        1675272.00
FS.0          520.00
SS        1620265.00
CD45RA         21.41
CCR7           10.15
CD28            2.48
PD1            15.34
CD27           16.49
CD4            -0.60
CD8            32.84
CD3            18.20
CD57           27.75
CD45           33.62
dtype: float64, NBNode('/AllCells/CD4-/CD8+/naive', counter=5, decision_name=['CCR7', 'CD45RA'], decision_value=[1, 1]): FS        1675272.00
FS.0          520.00
SS        1620265.00
CD45RA         21.41
CCR7           10.15
CD28            2.48
PD1            15.34
CD27           16.49
CD4            -0.60
CD8            32.84
CD3            18.20
CD57           27.75
CD45           33.62
dtype: float64, NBNode('/AllCells/CD4-/CD8+/Tcm', counter=0, decision_name=['CCR7', 'CD45RA'], decision_value=[1, -1]): FS        0
FS.0      0
SS        0
CD45RA    0
CCR7      0
CD28      0
PD1       0
CD27      0
CD4       0
CD8       0
CD3       0
CD57      0
CD45      0
dtype: int64, NBNode('/AllCells/CD4-/CD8+/Temra', counter=0, decision_name=['CCR7', 'CD45RA'], decision_value=[-1, 1]): FS        0
FS.0      0
SS        0
CD45RA    0
CCR7      0
CD28      0
PD1       0
CD27      0
CD4       0
CD8       0
CD3       0
CD57      0
CD45      0
dtype: int64, NBNode('/AllCells/CD4-/CD8+/Tem', counter=0, decision_name=['CCR7', 'CD45RA'], decision_value=[-1, -1]): FS        0
FS.0      0
SS        0
CD45RA    0
CCR7      0
CD28      0
PD1       0
CD27      0
CD4       0
CD8       0
CD3       0
CD57      0
CD45      0
dtype: int64, NBNode('/AllCells/CD4+/CD8-', counter=21, decision_name=['CD4', 'CD8'], decision_value=[1, -1]): FS        6488119.00
FS.0         2247.00
SS        8491889.00
CD45RA         57.21
CCR7           47.40
CD28           62.50
PD1            78.43
CD27           58.78
CD4            84.60
CD8           -33.29
CD3            36.06
CD57           73.44
CD45          132.69
dtype: float64, NBNode('/AllCells/CD4+/CD8-/naive', counter=20, decision_name=['CCR7', 'CD45RA'], decision_value=[1, 1]): FS        6116150.00
FS.0         2146.00
SS        8234532.00
CD45RA         51.22
CCR7           47.44
CD28           60.27
PD1            79.05
CD27           57.58
CD4            81.01
CD8           -32.36
CD3            34.95
CD57           69.94
CD45          126.00
dtype: float64, NBNode('/AllCells/CD4+/CD8-/Tcm', counter=0, decision_name=['CCR7', 'CD45RA'], decision_value=[1, -1]): FS        0
FS.0      0
SS        0
CD45RA    0
CCR7      0
CD28      0
PD1       0
CD27      0
CD4       0
CD8       0
CD3       0
CD57      0
CD45      0
dtype: int64, NBNode('/AllCells/CD4+/CD8-/Temra', counter=1, decision_name=['CCR7', 'CD45RA'], decision_value=[-1, 1]): FS        371969.00
FS.0         101.00
SS        257357.00
CD45RA         5.99
CCR7          -0.04
CD28           2.23
PD1           -0.62
CD27           1.20
CD4            3.59
CD8           -0.93
CD3            1.11
CD57           3.50
CD45           6.69
dtype: float64, NBNode('/AllCells/CD4+/CD8-/Tem', counter=0, decision_name=['CCR7', 'CD45RA'], decision_value=[-1, -1]): FS        0
FS.0      0
SS        0
CD45RA    0
CCR7      0
CD28      0
PD1       0
CD27      0
CD4       0
CD8       0
CD3       0
CD57      0
CD45      0
dtype: int64}
/home/gugl/.conda_envs/nbnode_pyscaffold/lib/python3.8/site-packages/nbnode/nbnode.py:353: UserWarning: self.ids was an empty list, subset an empty dataframe. Did you call celltree.id_preds(predicted_nodes)? Can also be a node with no cells.
  warnings.warn(
/home/gugl/.conda_envs/nbnode_pyscaffold/lib/python3.8/site-packages/nbnode/nbnode.py:353: UserWarning: self.ids was an empty list, subset an empty dataframe. Did you call celltree.id_preds(predicted_nodes)? Can also be a node with no cells.
  warnings.warn(
/home/gugl/.conda_envs/nbnode_pyscaffold/lib/python3.8/site-packages/nbnode/nbnode.py:353: UserWarning: self.ids was an empty list, subset an empty dataframe. Did you call celltree.id_preds(predicted_nodes)? Can also be a node with no cells.
  warnings.warn(
/home/gugl/.conda_envs/nbnode_pyscaffold/lib/python3.8/site-packages/nbnode/nbnode.py:353: UserWarning: self.ids was an empty list, subset an empty dataframe. Did you call celltree.id_preds(predicted_nodes)? Can also be a node with no cells.
  warnings.warn(
/home/gugl/.conda_envs/nbnode_pyscaffold/lib/python3.8/site-packages/nbnode/nbnode.py:353: UserWarning: self.ids was an empty list, subset an empty dataframe. Did you call celltree.id_preds(predicted_nodes)? Can also be a node with no cells.
  warnings.warn(
/home/gugl/.conda_envs/nbnode_pyscaffold/lib/python3.8/site-packages/nbnode/nbnode.py:353: UserWarning: self.ids was an empty list, subset an empty dataframe. Did you call celltree.id_preds(predicted_nodes)? Can also be a node with no cells.
  warnings.warn(
/home/gugl/.conda_envs/nbnode_pyscaffold/lib/python3.8/site-packages/nbnode/nbnode.py:353: UserWarning: self.ids was an empty list, subset an empty dataframe. Did you call celltree.id_preds(predicted_nodes)? Can also be a node with no cells.
  warnings.warn(
/home/gugl/.conda_envs/nbnode_pyscaffold/lib/python3.8/site-packages/nbnode/nbnode.py:353: UserWarning: self.ids was an empty list, subset an empty dataframe. Did you call celltree.id_preds(predicted_nodes)? Can also be a node with no cells.
  warnings.warn(
/home/gugl/.conda_envs/nbnode_pyscaffold/lib/python3.8/site-packages/nbnode/nbnode.py:353: UserWarning: self.ids was an empty list, subset an empty dataframe. Did you call celltree.id_preds(predicted_nodes)? Can also be a node with no cells.
  warnings.warn(
/home/gugl/.conda_envs/nbnode_pyscaffold/lib/python3.8/site-packages/nbnode/nbnode.py:353: UserWarning: self.ids was an empty list, subset an empty dataframe. Did you call celltree.id_preds(predicted_nodes)? Can also be a node with no cells.
  warnings.warn(
/home/gugl/.conda_envs/nbnode_pyscaffold/lib/python3.8/site-packages/nbnode/nbnode.py:353: UserWarning: self.ids was an empty list, subset an empty dataframe. Did you call celltree.id_preds(predicted_nodes)? Can also be a node with no cells.
  warnings.warn(
/home/gugl/.conda_envs/nbnode_pyscaffold/lib/python3.8/site-packages/nbnode/nbnode.py:353: UserWarning: self.ids was an empty list, subset an empty dataframe. Did you call celltree.id_preds(predicted_nodes)? Can also be a node with no cells.
  warnings.warn(
But it is probably often more useful to directly set a (new) attribute of each node to the result!
[6]:
# calculate the sum of all cells per column
def col_sum(df: pd.DataFrame):
    return df.apply(sum, axis=0)


print("\n\n\n")
res = cell_tree.apply(fun=col_sum, result_attribute_name="col_sum")
print(res is None)
print(cell_tree.col_sum)
True
FS        4.463310e+08
FS.0      1.077770e+05
SS        7.552312e+08
CD45RA    2.627850e+03
CCR7      2.423360e+03
CD28      2.544160e+03
PD1       2.563000e+03
CD27      2.087390e+03
CD4       1.559720e+03
CD8       2.202570e+03
CD3       1.274720e+03
CD57      3.276380e+03
CD45      5.539190e+03
dtype: float64
/home/gugl/.conda_envs/nbnode_pyscaffold/lib/python3.8/site-packages/nbnode/nbnode.py:353: UserWarning: self.ids was an empty list, subset an empty dataframe. Did you call celltree.id_preds(predicted_nodes)? Can also be a node with no cells.
  warnings.warn(
/home/gugl/.conda_envs/nbnode_pyscaffold/lib/python3.8/site-packages/nbnode/nbnode.py:353: UserWarning: self.ids was an empty list, subset an empty dataframe. Did you call celltree.id_preds(predicted_nodes)? Can also be a node with no cells.
  warnings.warn(
/home/gugl/.conda_envs/nbnode_pyscaffold/lib/python3.8/site-packages/nbnode/nbnode.py:353: UserWarning: self.ids was an empty list, subset an empty dataframe. Did you call celltree.id_preds(predicted_nodes)? Can also be a node with no cells.
  warnings.warn(
/home/gugl/.conda_envs/nbnode_pyscaffold/lib/python3.8/site-packages/nbnode/nbnode.py:353: UserWarning: self.ids was an empty list, subset an empty dataframe. Did you call celltree.id_preds(predicted_nodes)? Can also be a node with no cells.
  warnings.warn(
/home/gugl/.conda_envs/nbnode_pyscaffold/lib/python3.8/site-packages/nbnode/nbnode.py:353: UserWarning: self.ids was an empty list, subset an empty dataframe. Did you call celltree.id_preds(predicted_nodes)? Can also be a node with no cells.
  warnings.warn(
/home/gugl/.conda_envs/nbnode_pyscaffold/lib/python3.8/site-packages/nbnode/nbnode.py:353: UserWarning: self.ids was an empty list, subset an empty dataframe. Did you call celltree.id_preds(predicted_nodes)? Can also be a node with no cells.
  warnings.warn(
We also introduce a convenience wrapper: per_node_data_fun. It first transforms the data as datatable.Frame, then potentially restricts the data to a subset of columns and finally applies attributes (functions!) of datatable.Frame. Additionally we created a function to calculate the covariance matrix (based on datatable).
[7]:
from nbnode.nbnode_util import per_node_data_fun

print("\n\n\n")
cell_tree.apply(
    lambda x: per_node_data_fun(x=x, fun_name="mean"),
    result_attribute_name="mean",
)
print(cell_tree.mean)
print("\n\n")
cell_tree.apply(
    lambda x: per_node_data_fun(x=x, fun_name="cov"),
    result_attribute_name="cov",
)
print("\n\n")
cell_tree.cov
              FS        FS.0             SS   CD45RA      CCR7      CD28
0  446777.783784  107.884885  755987.182182  2.63048  2.425786  2.546707  \

        PD1      CD27       CD4       CD8       CD3     CD57      CD45
0  2.565566  2.089479  1.561281  2.204775  1.275996  3.27966  5.544735
/home/gugl/.conda_envs/nbnode_pyscaffold/lib/python3.8/site-packages/nbnode/nbnode.py:353: UserWarning: self.ids was an empty list, subset an empty dataframe. Did you call celltree.id_preds(predicted_nodes)? Can also be a node with no cells.
  warnings.warn(
/home/gugl/.conda_envs/nbnode_pyscaffold/lib/python3.8/site-packages/nbnode/nbnode.py:353: UserWarning: self.ids was an empty list, subset an empty dataframe. Did you call celltree.id_preds(predicted_nodes)? Can also be a node with no cells.
  warnings.warn(
/home/gugl/.conda_envs/nbnode_pyscaffold/lib/python3.8/site-packages/nbnode/nbnode.py:353: UserWarning: self.ids was an empty list, subset an empty dataframe. Did you call celltree.id_preds(predicted_nodes)? Can also be a node with no cells.
  warnings.warn(
/home/gugl/.conda_envs/nbnode_pyscaffold/lib/python3.8/site-packages/nbnode/nbnode.py:353: UserWarning: self.ids was an empty list, subset an empty dataframe. Did you call celltree.id_preds(predicted_nodes)? Can also be a node with no cells.
  warnings.warn(
/home/gugl/.conda_envs/nbnode_pyscaffold/lib/python3.8/site-packages/nbnode/nbnode.py:353: UserWarning: self.ids was an empty list, subset an empty dataframe. Did you call celltree.id_preds(predicted_nodes)? Can also be a node with no cells.
  warnings.warn(
/home/gugl/.conda_envs/nbnode_pyscaffold/lib/python3.8/site-packages/nbnode/nbnode.py:353: UserWarning: self.ids was an empty list, subset an empty dataframe. Did you call celltree.id_preds(predicted_nodes)? Can also be a node with no cells.
  warnings.warn(
/home/gugl/.conda_envs/nbnode_pyscaffold/lib/python3.8/site-packages/nbnode/nbnode.py:353: UserWarning: self.ids was an empty list, subset an empty dataframe. Did you call celltree.id_preds(predicted_nodes)? Can also be a node with no cells.
  warnings.warn(
[7]:
| FS | FS.0 | SS | CD45RA | CCR7 | CD28 | PD1 | CD27 | CD4 | CD8 | CD3 | CD57 | CD45 | |
|---|---|---|---|---|---|---|---|---|---|---|---|---|---|
| FS | 2.165583e+10 | 6.147502e+05 | 3.620725e+10 | -39147.927371 | -14758.007195 | 2558.966552 | 11245.428569 | -82448.944161 | -83005.474472 | -33479.754087 | -103486.452630 | 5706.132441 | -26665.567051 |
| FS.0 | 6.147502e+05 | 1.254948e+02 | 1.563292e+06 | -0.995866 | -0.464734 | -0.241061 | 1.563517 | -3.511773 | -2.612908 | -1.555762 | -5.162145 | 0.418738 | -0.143062 |
| SS | 3.620725e+10 | 1.563292e+06 | 1.060875e+11 | -126466.386170 | -36703.726977 | 10494.293897 | 20883.824316 | -232079.856598 | -223074.687248 | -114591.527895 | -284654.480683 | -20623.042663 | -101119.493078 |
| CD45RA | -3.914793e+04 | -9.958665e-01 | -1.264664e+05 | 1.377467 | 0.424056 | -0.225620 | -0.058146 | 0.531804 | 0.254024 | 0.488336 | 0.467378 | 0.423125 | 0.483976 |
| CCR7 | -1.475801e+04 | -4.647341e-01 | -3.670373e+04 | 0.424056 | 1.235744 | 0.711549 | 0.153438 | 1.180837 | 0.571201 | 0.342640 | 0.772448 | -0.124259 | 0.239509 |
| CD28 | 2.558967e+03 | -2.410609e-01 | 1.049429e+04 | -0.225620 | 0.711549 | 1.896833 | 0.177192 | 1.152222 | 0.648468 | 0.054631 | 0.807809 | -0.530344 | 0.117106 |
| PD1 | 1.124543e+04 | 1.563517e+00 | 2.088382e+04 | -0.058146 | 0.153438 | 0.177192 | 1.161104 | 0.027818 | 0.205716 | -0.008117 | 0.141911 | 0.209764 | 0.143325 |
| CD27 | -8.244894e+04 | -3.511773e+00 | -2.320799e+05 | 0.531804 | 1.180837 | 1.152222 | 0.027818 | 3.862032 | 1.129160 | 1.014295 | 1.892278 | -0.049220 | 0.553066 |
| CD4 | -8.300547e+04 | -2.612908e+00 | -2.230747e+05 | 0.254024 | 0.571201 | 0.648468 | 0.205716 | 1.129160 | 1.703458 | -0.054002 | 1.091317 | -0.102284 | 0.512471 |
| CD8 | -3.347975e+04 | -1.555762e+00 | -1.145915e+05 | 0.488336 | 0.342640 | 0.054631 | -0.008117 | 1.014295 | -0.054002 | 2.119584 | 1.205916 | 0.385426 | 0.343696 |
| CD3 | -1.034865e+05 | -5.162145e+00 | -2.846545e+05 | 0.467378 | 0.772448 | 0.807809 | 0.141911 | 1.892278 | 1.091317 | 1.205916 | 2.316320 | 0.125443 | 0.564875 |
| CD57 | 5.706132e+03 | 4.187383e-01 | -2.062304e+04 | 0.423125 | -0.124259 | -0.530344 | 0.209764 | -0.049220 | -0.102284 | 0.385426 | 0.125443 | 0.886665 | 0.296332 |
| CD45 | -2.666557e+04 | -1.430616e-01 | -1.011195e+05 | 0.483976 | 0.239509 | 0.117106 | 0.143325 | 0.553066 | 0.512471 | 0.343696 | 0.564875 | 0.296332 | 0.605821 |
Importantly, the apply function is done on all nodes separately, therefore also the result_attribute_name is set for each node separately!
[8]:
cell_tree.pretty_print()
cell_tree["/AllCells/CD4+/CD8-"].cov
AllCells (counter:999)
├── DN (counter:0)
├── DP (counter:973)
├── CD4-/CD8+ (counter:5)
│   ├── naive (counter:5)
│   ├── Tcm (counter:0)
│   ├── Temra (counter:0)
│   └── Tem (counter:0)
└── CD4+/CD8- (counter:21)
    ├── naive (counter:20)
    ├── Tcm (counter:0)
    ├── Temra (counter:1)
    └── Tem (counter:0)
[8]:
| FS | FS.0 | SS | CD45RA | CCR7 | CD28 | PD1 | CD27 | CD4 | CD8 | CD3 | CD57 | CD45 | |
|---|---|---|---|---|---|---|---|---|---|---|---|---|---|
| FS | 8.579379e+09 | -70918.9500 | 1.983754e+10 | 55738.251286 | -47391.339857 | -70431.262810 | 62951.568762 | -105445.765952 | -108395.155929 | -5903.629738 | -168594.759857 | 76528.430143 | -23592.250929 |
| FS.0 | -7.091895e+04 | 161.5000 | 6.775819e+05 | 4.836000 | 0.256000 | -5.529000 | 5.402000 | -13.373000 | -2.360500 | -0.549000 | -8.939000 | 2.551000 | 0.333000 |
| SS | 1.983754e+10 | 677581.9500 | 7.257807e+10 | 78956.079500 | 7015.310000 | -61653.769333 | 381992.605667 | -65083.371833 | -297815.850500 | -87121.889333 | -440940.419500 | 283685.350500 | -83679.807500 |
| CD45RA | 5.573825e+04 | 4.8360 | 7.895608e+04 | 1.984566 | -0.231057 | -0.625068 | 0.014314 | -1.343086 | -0.634414 | -0.121121 | -1.264832 | 0.641103 | 0.006621 |
| CCR7 | -4.739134e+04 | 0.2560 | 7.015310e+03 | -0.231057 | 2.119731 | 1.837819 | 1.227909 | 2.731482 | 0.721181 | -0.526321 | 1.609736 | 0.085096 | 0.045586 |
| CD28 | -7.043126e+04 | -5.5290 | -6.165377e+04 | -0.625068 | 1.837819 | 4.233845 | 1.408394 | 4.528386 | 1.430229 | -1.169376 | 3.352144 | -0.117211 | -0.155401 |
| PD1 | 6.295157e+04 | 5.4020 | 3.819926e+05 | 0.014314 | 1.227909 | 1.408394 | 4.538896 | 1.954455 | -1.065938 | -1.859649 | -1.890051 | 2.319644 | -0.639173 |
| CD27 | -1.054458e+05 | -13.3730 | -6.508337e+04 | -1.343086 | 2.731482 | 4.528386 | 1.954455 | 8.181249 | 1.576484 | -1.738945 | 3.635942 | 0.463187 | -0.032486 |
| CD4 | -1.083952e+05 | -2.3605 | -2.978159e+05 | -0.634414 | 0.721181 | 1.430229 | -1.065938 | 1.576484 | 1.823103 | 0.092512 | 2.923721 | -1.296814 | 0.386778 |
| CD8 | -5.903630e+03 | -0.5490 | -8.712189e+04 | -0.121121 | -0.526321 | -1.169376 | -1.859649 | -1.738945 | 0.092512 | 1.651106 | 0.266684 | -1.010761 | 0.280202 |
| CD3 | -1.685948e+05 | -8.9390 | -4.409404e+05 | -1.264832 | 1.609736 | 3.352144 | -1.890051 | 3.635942 | 2.923721 | 0.266684 | 5.852411 | -2.329204 | 0.543411 |
| CD57 | 7.652843e+04 | 2.5510 | 2.836854e+05 | 0.641103 | 0.085096 | -0.117211 | 2.319644 | 0.463187 | -1.296814 | -1.010761 | -2.329204 | 1.865231 | -0.371314 |
| CD45 | -2.359225e+04 | 0.3330 | -8.367981e+04 | 0.006621 | 0.045586 | -0.155401 | -0.639173 | -0.032486 | 0.386778 | 0.280202 | 0.543411 | -0.371314 | 0.261683 |
Finally, apply() does not need to use .data but can use any attribute present on all nodes.
[9]:
import nbnode.nbnode_trees as nbtree

cell_tree = nbtree.tree_complete_aligned_trunk()
cell_tree.data = cellmat
# When setting .data, we do not need to give the cellmat explicitely to .predict()
cell_tree.id_preds(cell_tree.predict())
cell_tree.count(use_ids=True)
for x in cell_tree.__dict__.keys():
    print(x)
print("\n\n")
name
_NodeMixin__children
decision_name
decision_value
decision_cutoff
counter
ids
_data
id_unique_dot_exporter
math_node_attribute
math_inplace
_long_print_attributes
/home/gugl/.conda_envs/nbnode_pyscaffold/lib/python3.8/site-packages/nbnode/nbnode.py:353: UserWarning: self.ids was an empty list, subset an empty dataframe. Did you call celltree.id_preds(predicted_nodes)? Can also be a node with no cells.
  warnings.warn(
[10]:
try:
    print(cell_tree.changed_decision_name)
except AttributeError as e:
    print("AttributeError: 'NBNode' object has no attribute 'changed_decision_name'")
cell_tree.apply(lambda x: x[0] + "___this_is_a_change" if x is not None else x, input_attribute_name="decision_name", result_attribute_name="changed_decision_name")
cell_tree.pretty_print(print_attributes=["decision_name", "changed_decision_name"])
AttributeError: 'NBNode' object has no attribute 'changed_decision_name'
AllCells (decision_name:None, changed_decision_name:None)
├── DN (decision_name:['CD4', 'CD8'], changed_decision_name:CD4___this_is_a_change)
├── DP (decision_name:['CD4', 'CD8'], changed_decision_name:CD4___this_is_a_change)
├── CD4-/CD8+ (decision_name:['CD4', 'CD8'], changed_decision_name:CD4___this_is_a_change)
│   ├── naive (decision_name:['CCR7', 'CD45RA'], changed_decision_name:CCR7___this_is_a_change)
│   ├── Tcm (decision_name:['CCR7', 'CD45RA'], changed_decision_name:CCR7___this_is_a_change)
│   ├── Temra (decision_name:['CCR7', 'CD45RA'], changed_decision_name:CCR7___this_is_a_change)
│   └── Tem (decision_name:['CCR7', 'CD45RA'], changed_decision_name:CCR7___this_is_a_change)
└── CD4+/CD8- (decision_name:['CD4', 'CD8'], changed_decision_name:CD4___this_is_a_change)
    ├── naive (decision_name:['CCR7', 'CD45RA'], changed_decision_name:CCR7___this_is_a_change)
    ├── Tcm (decision_name:['CCR7', 'CD45RA'], changed_decision_name:CCR7___this_is_a_change)
    ├── Temra (decision_name:['CCR7', 'CD45RA'], changed_decision_name:CCR7___this_is_a_change)
    └── Tem (decision_name:['CCR7', 'CD45RA'], changed_decision_name:CCR7___this_is_a_change)
Plotting
For plotting we have two major steps:
Generate a
`.dot<https://graphviz.org/doc/info/lang.html>`__ file with anytreeUse
`graphviz<https://graphviz.org/download/>`__ as engine to make the plots
Potentially you have to install graphviz.
[11]:
import nbnode.nbnode_trees as nbtree

cell_tree = nbtree.tree_complete_aligned_trunk()
exported_dot = cell_tree.export_dot()
print(exported_dot)
digraph tree {
    node [shape=box, style="filled", color="black"];
    "0x7f6217352b80" [label="None", fillcolor="white"];
    "0x7f628c31cfa0" [label="None", fillcolor="white"];
    "0x7f628c31c9d0" [label="None", fillcolor="white"];
    "0x7f628c31cb20" [label="None", fillcolor="white"];
    "0x7f6217352670" [label="None", fillcolor="white"];
    "0x7f6217352730" [label="None", fillcolor="white"];
    "0x7f6217352610" [label="None", fillcolor="white"];
    "0x7f6217352820" [label="None", fillcolor="white"];
    "0x7f6217352d00" [label="None", fillcolor="white"];
    "0x7f6217352190" [label="None", fillcolor="white"];
    "0x7f6217352850" [label="None", fillcolor="white"];
    "0x7f62173528b0" [label="None", fillcolor="white"];
    "0x7f62173528e0" [label="None", fillcolor="white"];
    "0x7f6217352b80" -> "0x7f628c31cfa0";
    "0x7f6217352b80" -> "0x7f628c31c9d0";
    "0x7f6217352b80" -> "0x7f628c31cb20";
    "0x7f6217352b80" -> "0x7f6217352d00";
    "0x7f628c31cb20" -> "0x7f6217352670";
    "0x7f628c31cb20" -> "0x7f6217352730";
    "0x7f628c31cb20" -> "0x7f6217352610";
    "0x7f628c31cb20" -> "0x7f6217352820";
    "0x7f6217352d00" -> "0x7f6217352190";
    "0x7f6217352d00" -> "0x7f6217352850";
    "0x7f6217352d00" -> "0x7f62173528b0";
    "0x7f6217352d00" -> "0x7f62173528e0";
}
[12]:
print(cell_tree.graph_from_dot())


from nbnode.plot.utils import plot_save_unified
plot_save_unified(cell_tree.graph_from_dot(), "cell_tree.pdf")

from wand.image import Image as WImage
img = WImage(filename='cell_tree.pdf')
img
<pydotplus.graphviz.Dot object at 0x7f62141db820>
[12]:
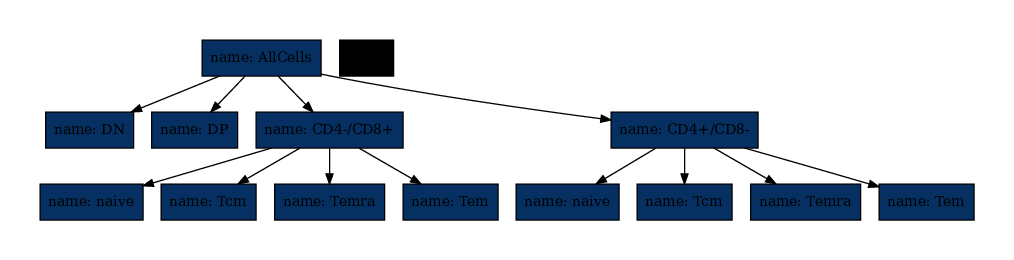
Classically, the colors visualize the number of cells in each node (counter). Up to this point we did not count, so let’s do that.
[13]:
cell_tree.data = cellmat
# When setting .data, we do not need to give the cellmat explicitely to .predict()
cell_tree.id_preds(cell_tree.predict())
cell_tree.count(use_ids=True)
cell_tree.pretty_print()
AllCells (counter:999)
├── DN (counter:0)
├── DP (counter:973)
├── CD4-/CD8+ (counter:5)
│   ├── naive (counter:5)
│   ├── Tcm (counter:0)
│   ├── Temra (counter:0)
│   └── Tem (counter:0)
└── CD4+/CD8- (counter:21)
    ├── naive (counter:20)
    ├── Tcm (counter:0)
    ├── Temra (counter:1)
    └── Tem (counter:0)
/home/gugl/.conda_envs/nbnode_pyscaffold/lib/python3.8/site-packages/nbnode/nbnode.py:353: UserWarning: self.ids was an empty list, subset an empty dataframe. Did you call celltree.id_preds(predicted_nodes)? Can also be a node with no cells.
[14]:
plot_save_unified(cell_tree.graph_from_dot(), "cell_tree.pdf")

from wand.image import Image as WImage
img = WImage(filename='cell_tree.pdf')
img
[14]:
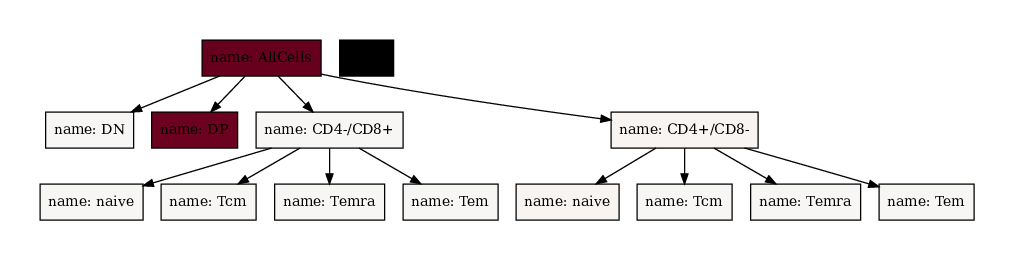
All cells are in the root node (/AllCells), therefore it is deep red. Also there are so many DP cells that all other nodes are essentially white. Let’s force maximum saturation (red) at value 50 and minimum saturation (white) at value 0!
[15]:
cell_tree.pretty_print()
plot_save_unified(
    cell_tree.graph_from_dot(
        fillcolor_node_attribute="counter",
        custom_min_max_dict={"min": 0, "max": 50},
    ),
    "cell_tree.pdf",
)

from wand.image import Image as WImage

img = WImage(filename="cell_tree.pdf")
img
AllCells (counter:999)
├── DN (counter:0)
├── DP (counter:973)
├── CD4-/CD8+ (counter:5)
│   ├── naive (counter:5)
│   ├── Tcm (counter:0)
│   ├── Temra (counter:0)
│   └── Tem (counter:0)
└── CD4+/CD8- (counter:21)
    ├── naive (counter:20)
    ├── Tcm (counter:0)
    ├── Temra (counter:1)
    └── Tem (counter:0)
[15]:
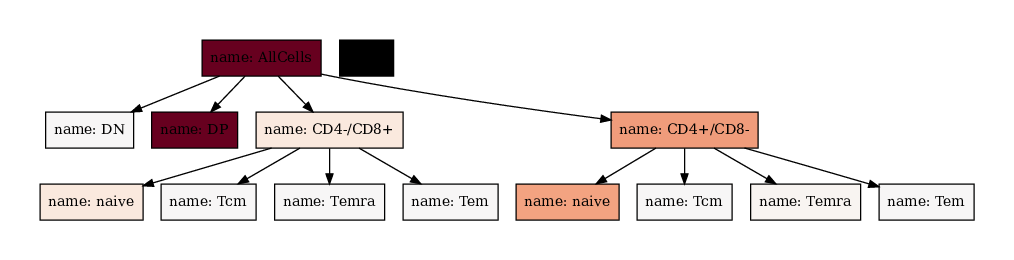
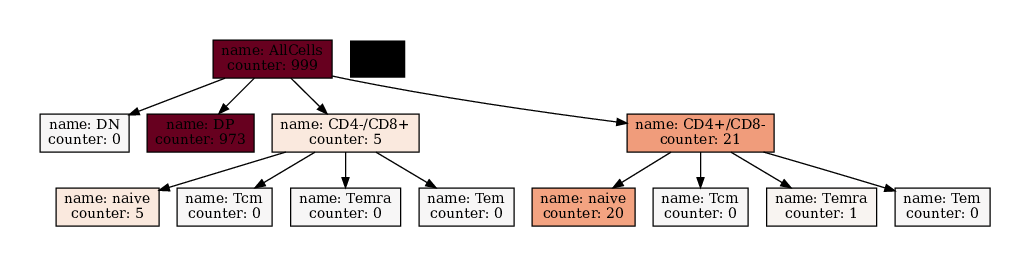
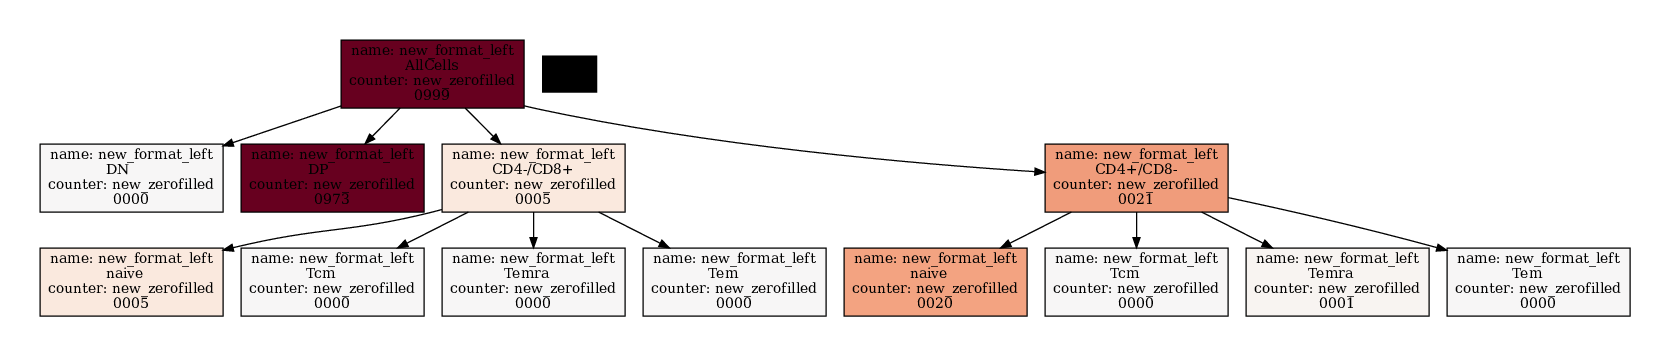
We can also modify the text printed with the node_text_attributes argument. If only a list of elements is given, the result is always value_name:value. To make more sophisticated formatting you can supply a Dict[str, str] which contains the attribute name as key and the `f-string <https://note.nkmk.me/en/python-f-strings/>`__ as value.
[16]:
cell_tree.pretty_print()
plot_save_unified(
    cell_tree.graph_from_dot(
    fillcolor_node_attribute="counter",
    custom_min_max_dict={"min": 0, "max": 50},
    node_text_attributes=["name", "counter"],
    ),
    "cell_tree.pdf")

from wand.image import Image as WImage
img = WImage(filename='cell_tree.pdf')
img
AllCells (counter:999)
├── DN (counter:0)
├── DP (counter:973)
├── CD4-/CD8+ (counter:5)
│   ├── naive (counter:5)
│   ├── Tcm (counter:0)
│   ├── Temra (counter:0)
│   └── Tem (counter:0)
└── CD4+/CD8- (counter:21)
    ├── naive (counter:20)
    ├── Tcm (counter:0)
    ├── Temra (counter:1)
    └── Tem (counter:0)
[16]:
[17]:
cell_tree.pretty_print()
plot_save_unified(
    cell_tree.graph_from_dot(
    fillcolor_node_attribute="counter",
    custom_min_max_dict={"min": 0, "max": 50},
    node_text_attributes={"name":"new_format_left\n{:<8}", "counter":"new_zerofilled\n{:04d}"},
    ),
    "cell_tree.pdf")

from wand.image import Image as WImage
img = WImage(filename='cell_tree.pdf')
img
AllCells (counter:999)
├── DN (counter:0)
├── DP (counter:973)
├── CD4-/CD8+ (counter:5)
│   ├── naive (counter:5)
│   ├── Tcm (counter:0)
│   ├── Temra (counter:0)
│   └── Tem (counter:0)
└── CD4+/CD8- (counter:21)
    ├── naive (counter:20)
    ├── Tcm (counter:0)
    ├── Temra (counter:1)
    └── Tem (counter:0)
[17]:
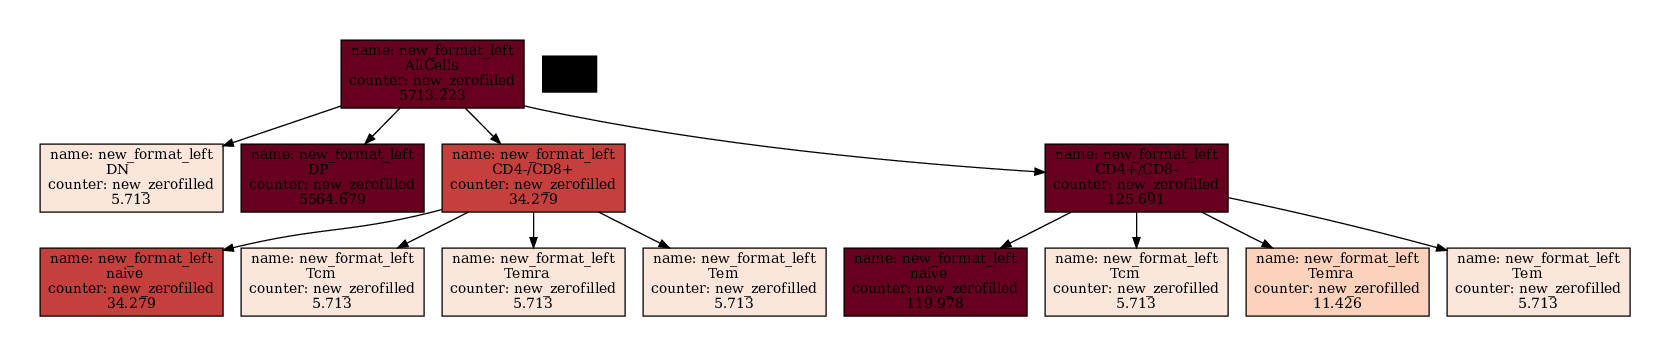
If you want to apply math to the nodes you have to do that outside.
[18]:
new_tree = (cell_tree + 1)
new_tree.astype_math_node_attribute(float)
new_tree = new_tree * 5.713223

new_tree.pretty_print()
plot_save_unified(
    new_tree.graph_from_dot(
    fillcolor_node_attribute="counter",
    custom_min_max_dict={"min": 0, "max": 50},
    node_text_attributes={"name":"new_format_left\n{:<8}", "counter":"new_zerofilled\n{:.3f}"},
    ),
    "cell_tree.pdf")

from wand.image import Image as WImage
img = WImage(filename='cell_tree.pdf')
img
AllCells (counter:5713.223)
├── DN (counter:5.713223)
├── DP (counter:5564.679202)
├── CD4-/CD8+ (counter:34.279338)
│   ├── naive (counter:34.279338)
│   ├── Tcm (counter:5.713223)
│   ├── Temra (counter:5.713223)
│   └── Tem (counter:5.713223)
└── CD4+/CD8- (counter:125.690906)
    ├── naive (counter:119.977683)
    ├── Tcm (counter:5.713223)
    ├── Temra (counter:11.426446)
    └── Tem (counter:5.713223)
[18]:
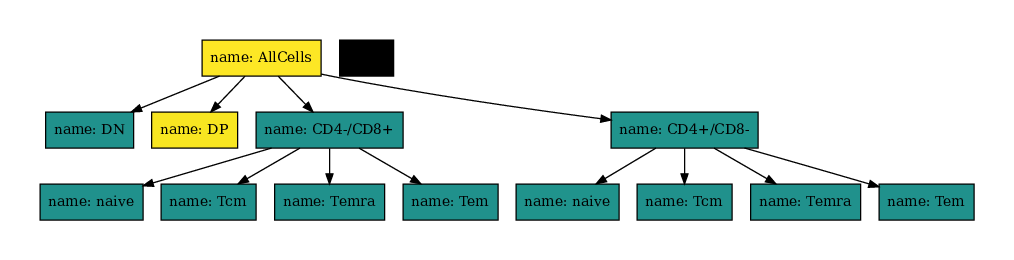
You can also change the color map also using matplotlibs color maps.
[20]:
import matplotlib as mpl

plot_save_unified(
    new_tree.graph_from_dot(
        fillcolor_node_attribute="counter",
        cmap=mpl.colormaps.get_cmap("viridis"),
    ),
    "cell_tree.pdf",
)

from wand.image import Image as WImage

img = WImage(filename="cell_tree.pdf")
img
[20]:
You can use usual pydotplus to make much more complex graphs:
[58]:
import pydotplus
import anytree.exporter as a_exp

from nbnode.plot.utils import plot_save_unified

simpletree = nbtree.tree_simple()
dot_data = a_exp.UniqueDotExporter(
    simpletree,
    options=['node [shape=box, style="filled", color="black"];'],
    nodeattrfunc=lambda node: 'label="{}", fillcolor="white"'.format(node.name),
)
dotdata_str = "\n".join([x for x in dot_data])
# print(dotdata_str)
graph: pydotplus.Dot = pydotplus.graph_from_dot_data(dotdata_str)
nodes = graph.get_node_list()

plot_save_unified(
    any_plot=graph, file="cell_tree.pdf"
)
from wand.image import Image as WImage
img = WImage(filename='cell_tree.pdf')
img
[58]:
[59]:
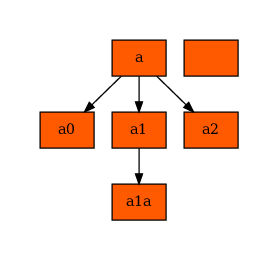
for node in nodes:
    if node.get_name() not in ("node", "edge", "plottitle"):
        node.set_fillcolor("#ff5a00")
# print(graph.to_string())
plot_save_unified(any_plot=graph, file="cell_tree.pdf")
from wand.image import Image as WImage
img = WImage(filename='cell_tree.pdf')
img
[59]: