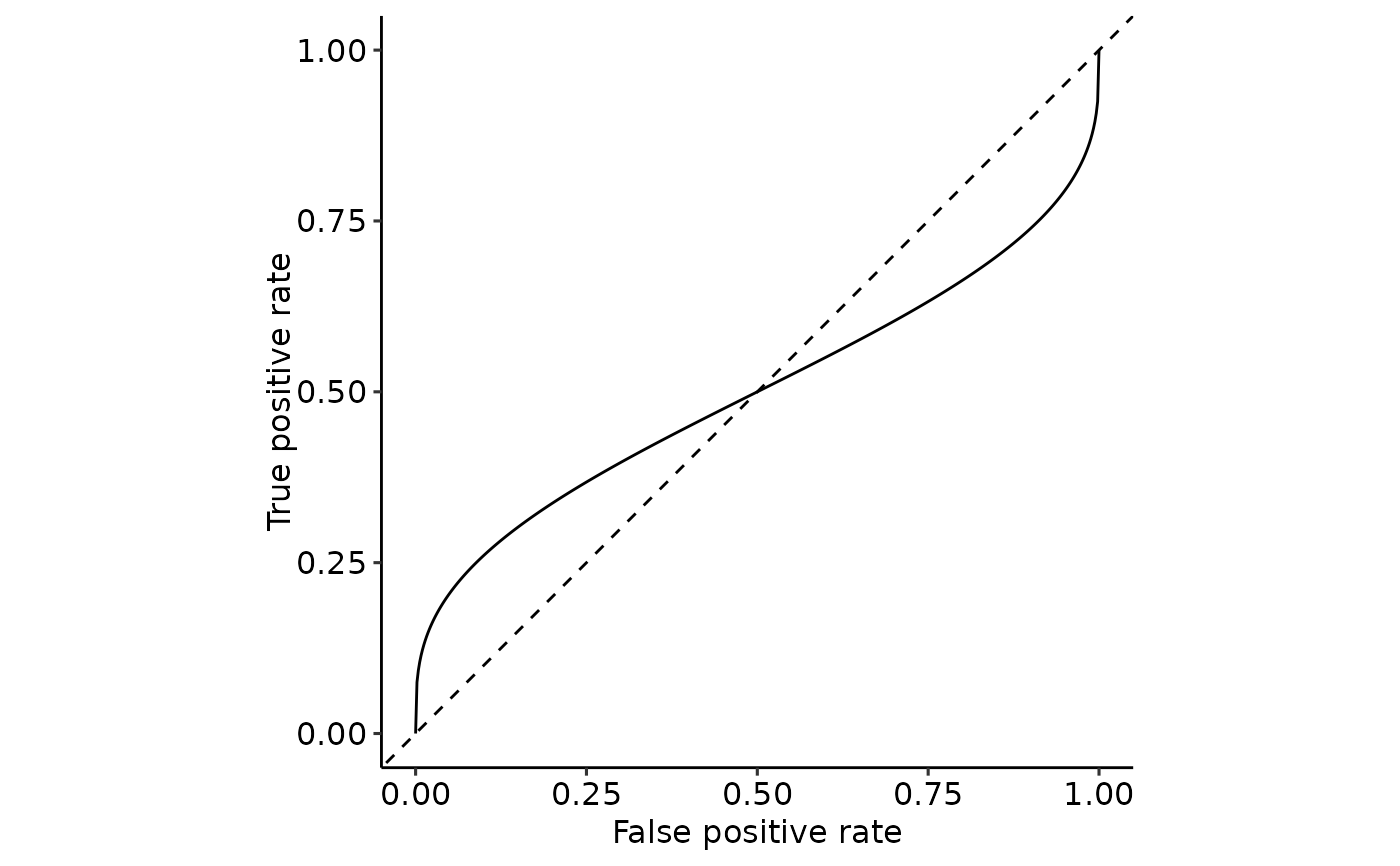
ROC curve for positive cumulative distribution and negative quantile function
Usage
plot_ROC_theoretical(pnorm_positive, qnorm_negative, length.out = 500)
Arguments
- pnorm_positive
Cumulative distribution function of positive class
- qnorm_negative
Quantile function (inverse of the cumulative distribution function) of the negative class
- length.out
How many false positive rates should the ROC-curve be calculated for?
Value
List of
- ggplot of the ROC curve
- AUC of the curve
Examples
plot_ROC_theoretical(
    pnorm_positive = function(x) pnorm(x, mean = 1, sd = 1),
    qnorm_negative = function(x) qnorm(x, mean = 1, sd = .5)
)
#> $plot

#>
#> $auc
#> 0.5 with absolute error < 5.6e-15
#>
#>
#> $auc
#> 0.5 with absolute error < 5.6e-15
#>