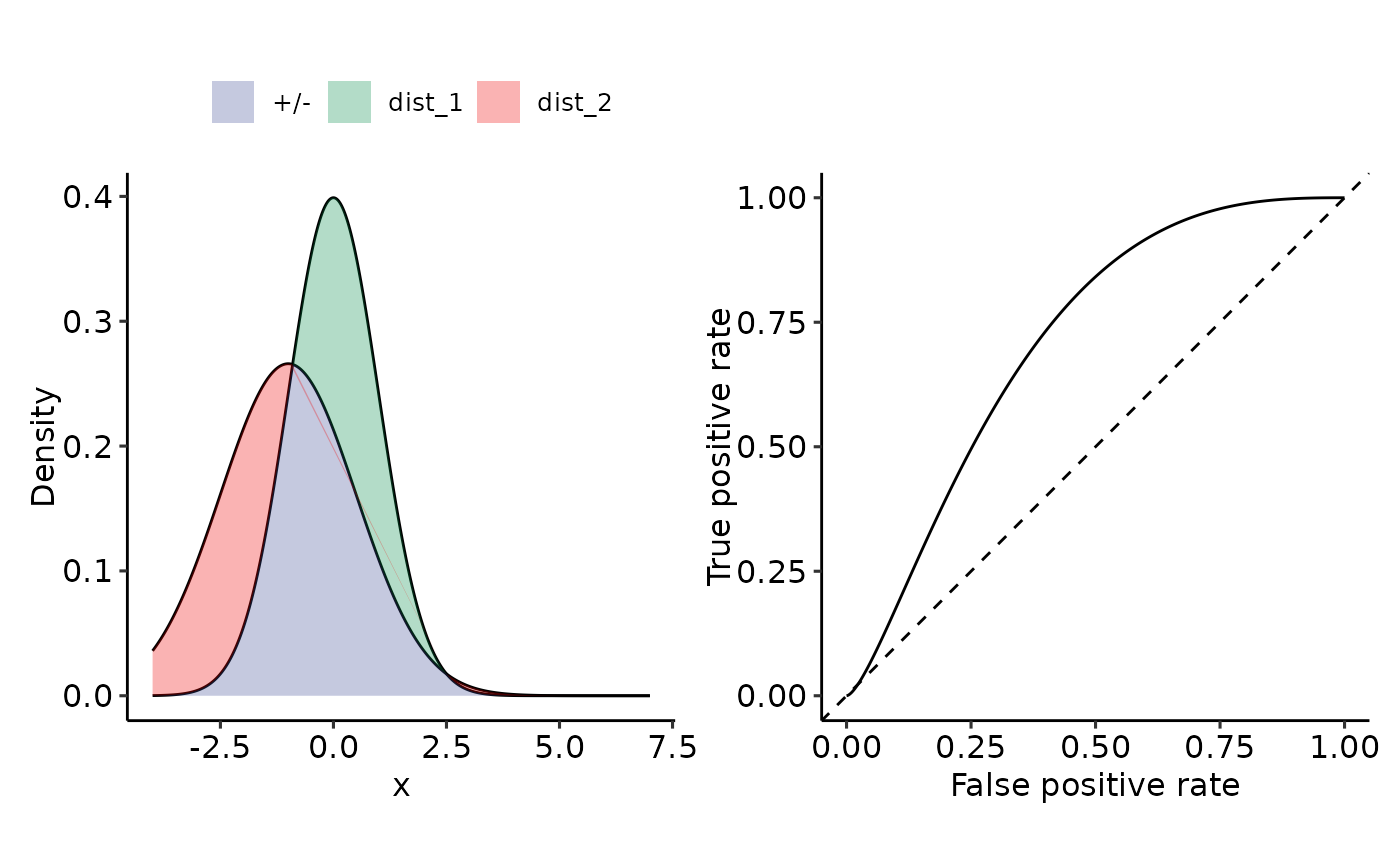
Plot density + ROC
plot_density_ROC.RdGiven positive and negative distributions, plot the corresponding densities and their ROC-curves.
Usage
plot_density_ROC(
  density_positive,
  cdf_positive,
  density_negative,
  quantile_negative,
  length.out = 500,
  xmin = -3,
  xmax = 3,
  colors_pos_neg_both = colors_pos_neg_both_default
)
Arguments
- density_positive
function(x) {}: Returns the density given a specific value x. Refers to values coming from the "positive"-class.- cdf_positive
function(q) {...}: Returns the cumulative distribution value given a specific quantileq. Refers to values coming from the "positive"-class.- density_negative
function(x) {}: Returns the density given a specific value x. Refers to values coming from the "negative"-class.- quantile_negative
function(x) {}: Returns the density given a specific value x. Refers to values coming from the "negative"-class.- length.out
The number of simulated points for the plots from the distributions.
length.outpoints will be generated between[xmin, xmax]. PURELY VISUAL, ROC curves are calculated based on the actual distributions!- xmin
Minimum value of simulated points for the plots from the distributions.
length.outpoints will be generated between[xmin, xmax]. PURELY VISUAL, ROC curves are calculated based on the actual distributions!- xmax
Maximum value of simulated points for the plots from the distributions.
length.outpoints will be generated between[xmin, xmax]. PURELY VISUAL, ROC curves are calculated based on the actual distributions!- colors_pos_neg_both
Colors for positive ("+"), negative ("-") and overlapping "+/-" areas of the densities
Examples
plot_density_ROC(
    density_positive = function(x) dnorm(x, mean = 0, sd = 1),
    cdf_positive = function(x) pnorm(x, mean = 0, sd = 1),
    density_negative = function(x) dnorm(x, mean = -1, sd = 1.5),
    quantile_negative = function(x) qnorm(x, mean = -1, sd = 1.5),
    xmin = -4, xmax = 7
)
#> $plot
#> Ignoring unknown labels:
#> • colour : ""

#>
#> $auc
#> 0.7104501 with absolute error < 8.1e-05
#>
#>
#> $auc
#> 0.7104501 with absolute error < 8.1e-05
#>