Plot density + ROC based on stats::_
plot_density_ROC_str.RdGiven positive and negative distribution NAMES and their arguments, plot the corresponding densities and their ROC-curves.
Arguments
- dist_positive_str
A name of any distribution of the
stats::package. E.g. "norm", "binom", "exp". This is the distribution of values coming from the "positive"-class. For all possible distributions check ?stats::Distributions- dist_negative
A name of any distribution of the
stats::package. E.g. "norm", "binom", "exp". This is the distribution of values coming from the "negative"-class. For all possible distributions check ?stats::Distributions- dist_positive_args
Arguments to
dist_positive_stras named list.- dist_negative_args
Arguments to
dist_negative_stras named list.- length.out
The number of simulated points for the plots from the distributions.
length.outpoints will be generated between[xmin, xmax]. PURELY VISUAL, ROC curves are calculated based on the actual distributions!- xmin
Minimum value of simulated points for the plots from the distributions.
length.outpoints will be generated between[xmin, xmax]. PURELY VISUAL, ROC curves are calculated based on the actual distributions!- xmax
Maximum value of simulated points for the plots from the distributions.
length.outpoints will be generated between[xmin, xmax]. PURELY VISUAL, ROC curves are calculated based on the actual distributions!
Examples
plot_density_ROC_str(length.out = 50)
#> $plot
#> Ignoring unknown labels:
#> • colour : ""
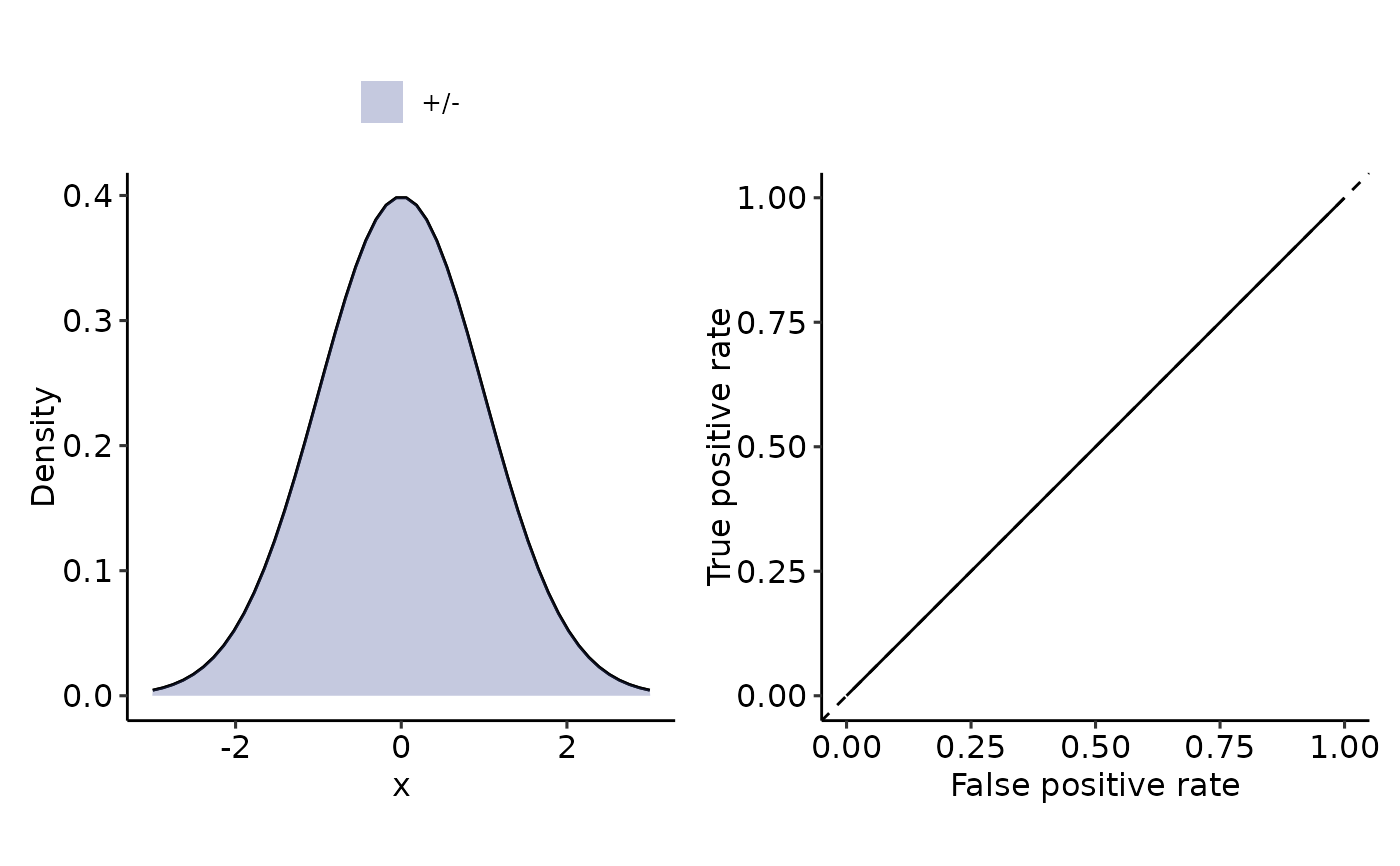 #>
#> $auc
#> 0.5 with absolute error < 5.6e-15
#>
plot_density_ROC_str(
dist_positive_str = "norm",
dist_negative = "norm",
dist_positive_args = list("mean" = 0, "sd" = 1),
dist_negative_args = list("mean" = 1, "sd" = 1),
xmin = -4, xmax = 7,
length.out = 50
)
#> $plot
#> Ignoring unknown labels:
#> • colour : ""
#>
#> $auc
#> 0.5 with absolute error < 5.6e-15
#>
plot_density_ROC_str(
dist_positive_str = "norm",
dist_negative = "norm",
dist_positive_args = list("mean" = 0, "sd" = 1),
dist_negative_args = list("mean" = 1, "sd" = 1),
xmin = -4, xmax = 7,
length.out = 50
)
#> $plot
#> Ignoring unknown labels:
#> • colour : ""
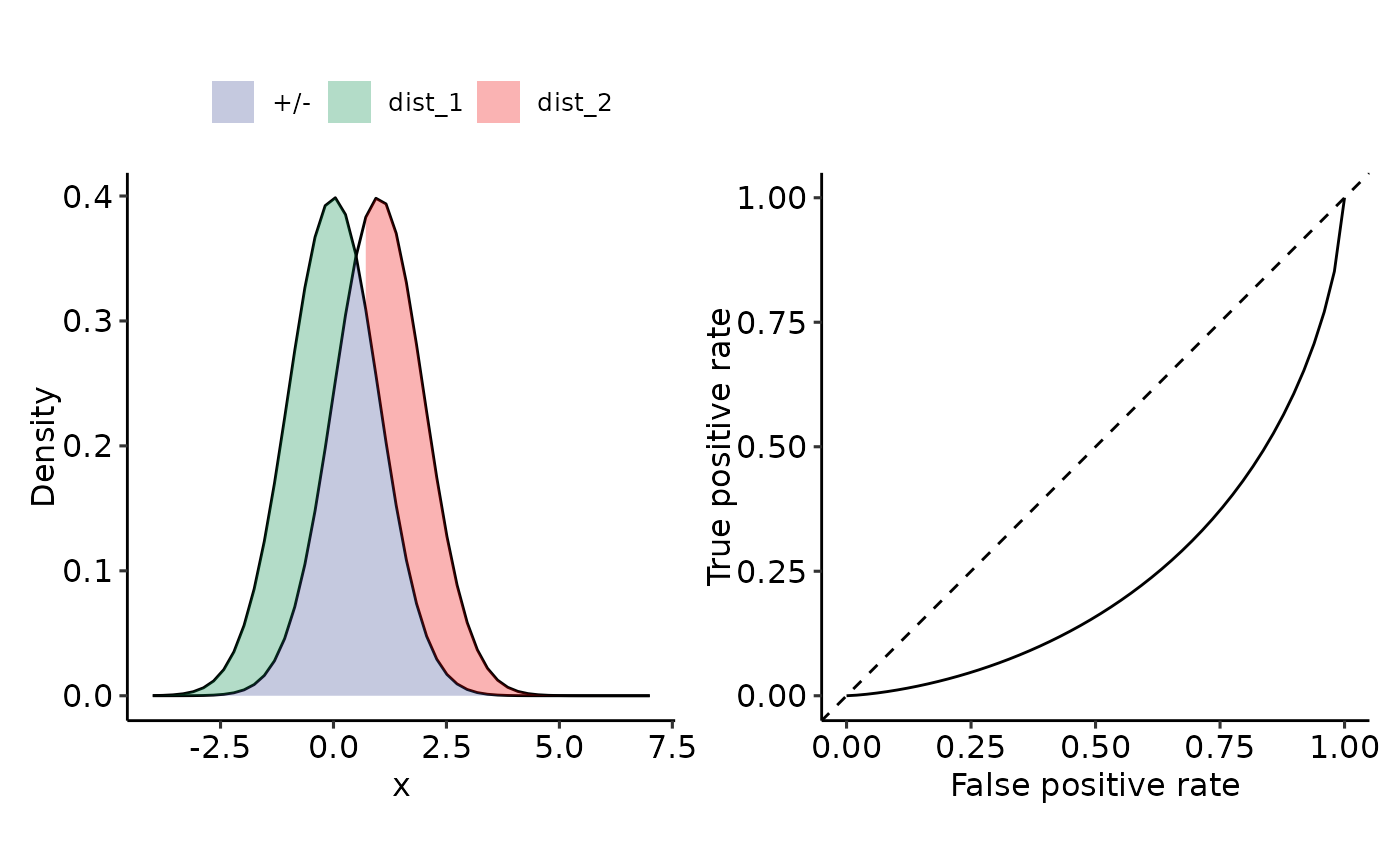 #>
#> $auc
#> 0.23975 with absolute error < 4.9e-05
#>
# pdf("removeme.pdf", width = 14, height = 6)
plot_density_ROC_str(
dist_positive_str = "norm",
dist_negative = "norm",
dist_positive_args = list("mean" = 1, "sd" = 1),
dist_negative_args = list("mean" = 0, "sd" = 1),
xmin = -4, xmax = 7,
length.out = 50
)
#> $plot
#> Ignoring unknown labels:
#> • colour : ""
#>
#> $auc
#> 0.23975 with absolute error < 4.9e-05
#>
# pdf("removeme.pdf", width = 14, height = 6)
plot_density_ROC_str(
dist_positive_str = "norm",
dist_negative = "norm",
dist_positive_args = list("mean" = 1, "sd" = 1),
dist_negative_args = list("mean" = 0, "sd" = 1),
xmin = -4, xmax = 7,
length.out = 50
)
#> $plot
#> Ignoring unknown labels:
#> • colour : ""
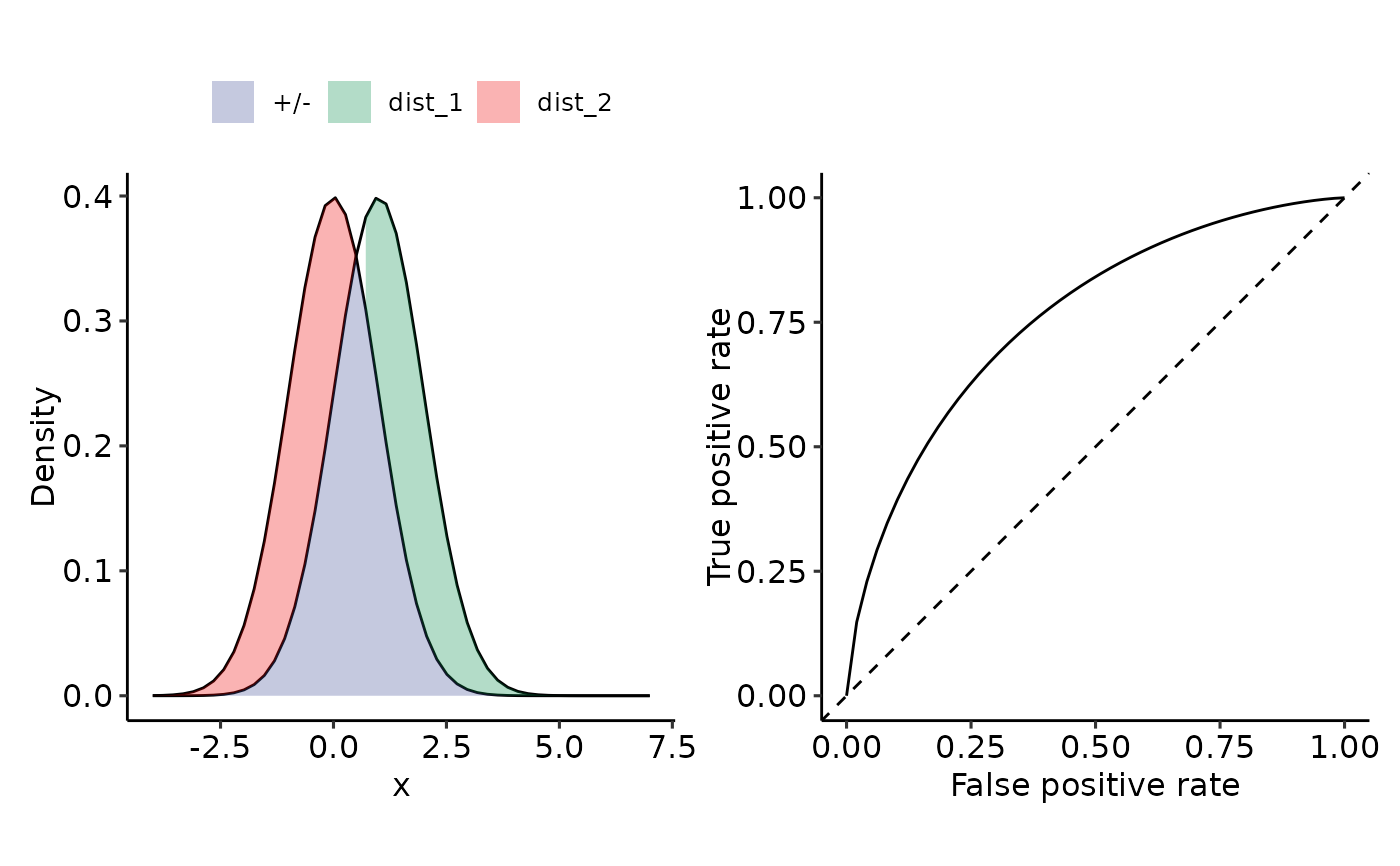 #>
#> $auc
#> 0.76025 with absolute error < 4.9e-05
#>
# dev.off()
# pdf("removeme_2.pdf", width = 14, height = 6)
plot_density_ROC_str(
dist_positive_str = "norm",
dist_negative = "norm",
dist_positive_args = list("mean" = 1, "sd" = .5),
dist_negative_args = list("mean" = 1, "sd" = 1),
xmin = -4, xmax = 7,
length.out = 50
)
#> $plot
#> Ignoring unknown labels:
#> • colour : ""
#>
#> $auc
#> 0.76025 with absolute error < 4.9e-05
#>
# dev.off()
# pdf("removeme_2.pdf", width = 14, height = 6)
plot_density_ROC_str(
dist_positive_str = "norm",
dist_negative = "norm",
dist_positive_args = list("mean" = 1, "sd" = .5),
dist_negative_args = list("mean" = 1, "sd" = 1),
xmin = -4, xmax = 7,
length.out = 50
)
#> $plot
#> Ignoring unknown labels:
#> • colour : ""
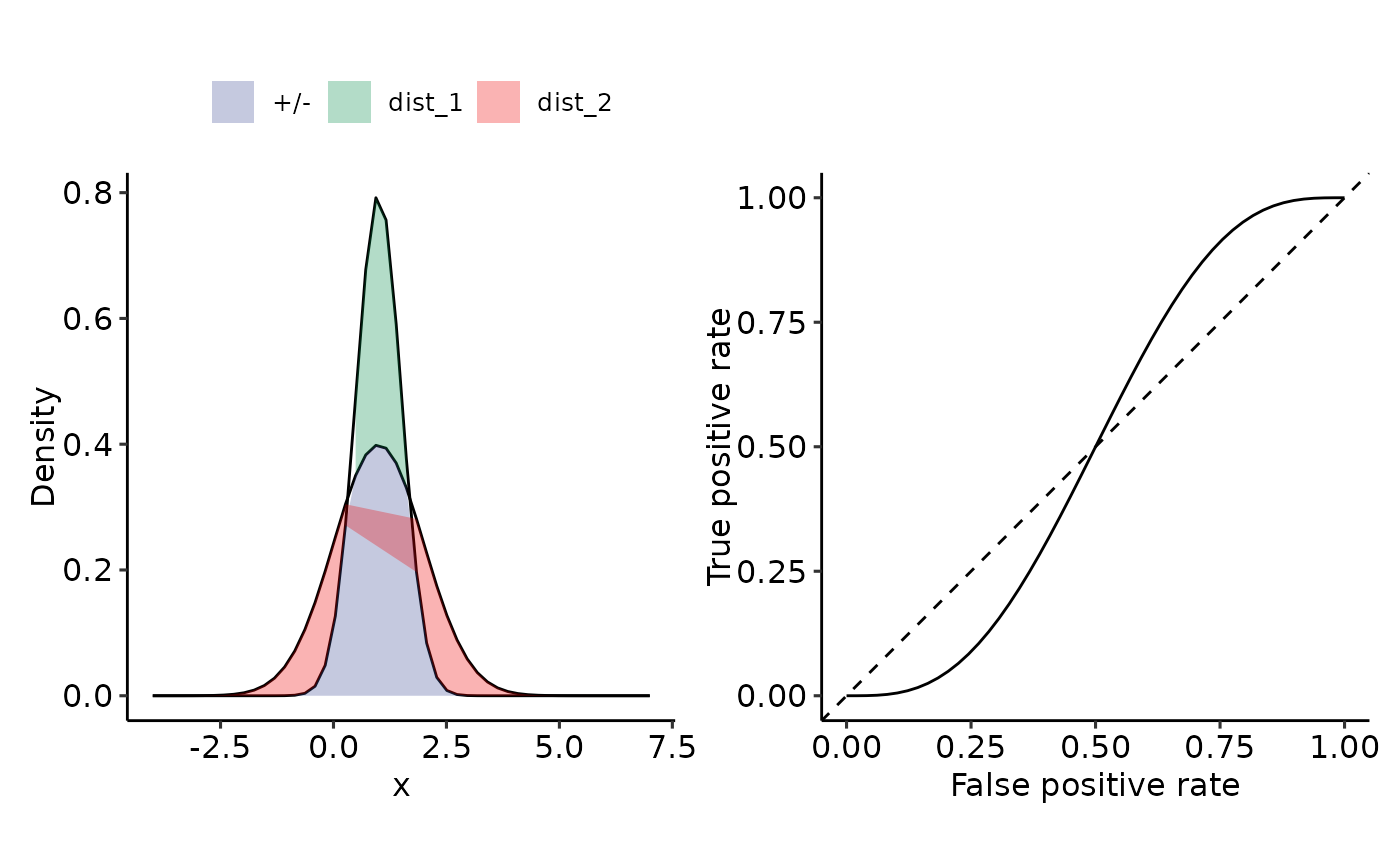 #>
#> $auc
#> 0.5 with absolute error < 5.6e-15
#>
# dev.off()
# pdf("removeme_3.pdf", width = 14, height = 6)
plot_density_ROC_str(
dist_positive_str = "norm",
dist_negative = "norm",
dist_positive_args = list("mean" = 1, "sd" = 2),
dist_negative_args = list("mean" = 1, "sd" = 1),
xmin = -4, xmax = 7,
length.out = 50
)
#> $plot
#> Ignoring unknown labels:
#> • colour : ""
#>
#> $auc
#> 0.5 with absolute error < 5.6e-15
#>
# dev.off()
# pdf("removeme_3.pdf", width = 14, height = 6)
plot_density_ROC_str(
dist_positive_str = "norm",
dist_negative = "norm",
dist_positive_args = list("mean" = 1, "sd" = 2),
dist_negative_args = list("mean" = 1, "sd" = 1),
xmin = -4, xmax = 7,
length.out = 50
)
#> $plot
#> Ignoring unknown labels:
#> • colour : ""
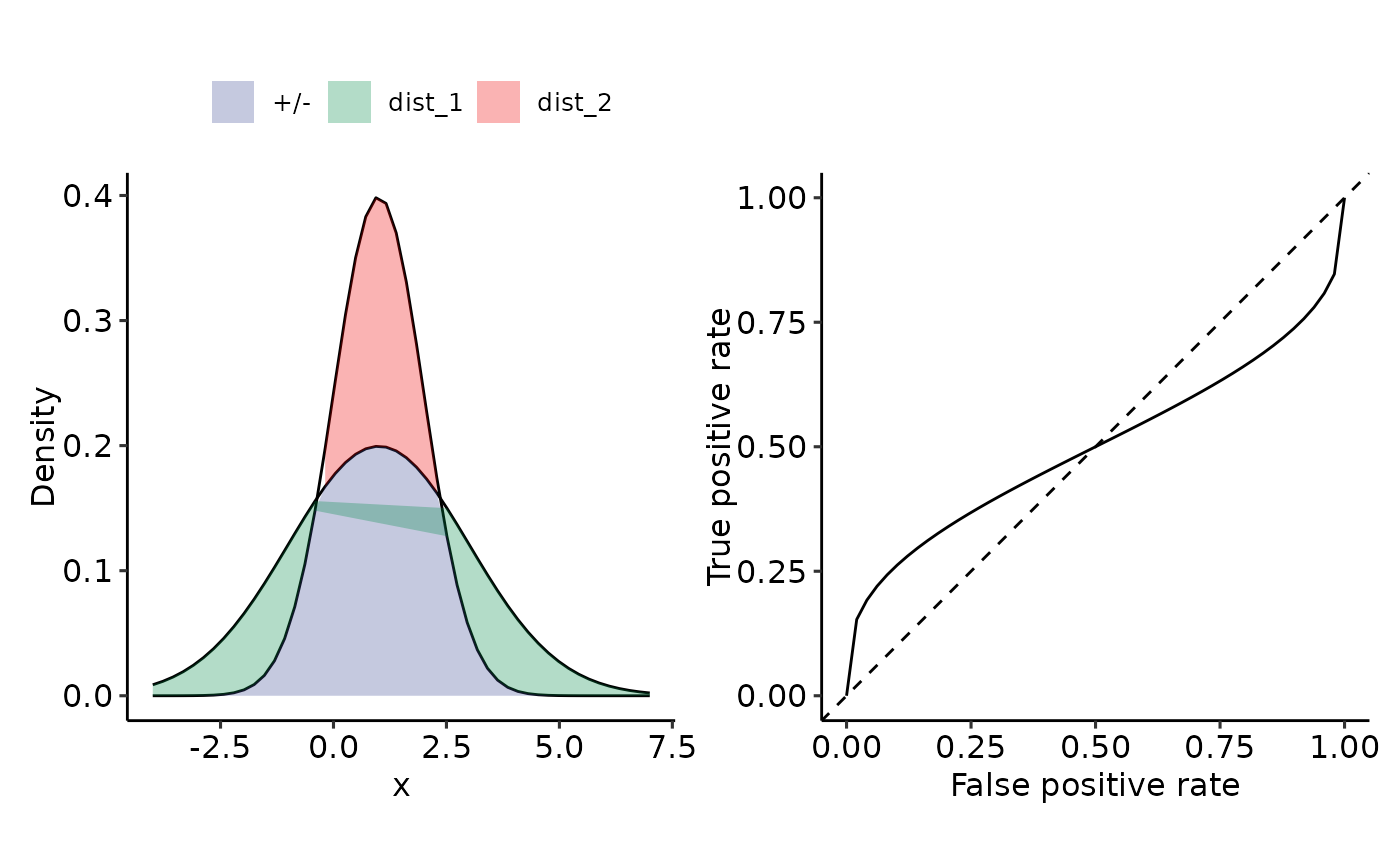 #>
#> $auc
#> 0.5 with absolute error < 5.6e-15
#>
# dev.off()
tmp <- plot_density_ROC_str(
dist_positive_str = "norm",
dist_negative = "norm",
dist_positive_args = list("mean" = 1, "sd" = 2),
dist_negative_args = list("mean" = 1, "sd" = 1),
xmin = -4, xmax = 7,
length.out = 50
)
#>
#> $auc
#> 0.5 with absolute error < 5.6e-15
#>
# dev.off()
tmp <- plot_density_ROC_str(
dist_positive_str = "norm",
dist_negative = "norm",
dist_positive_args = list("mean" = 1, "sd" = 2),
dist_negative_args = list("mean" = 1, "sd" = 1),
xmin = -4, xmax = 7,
length.out = 50
)