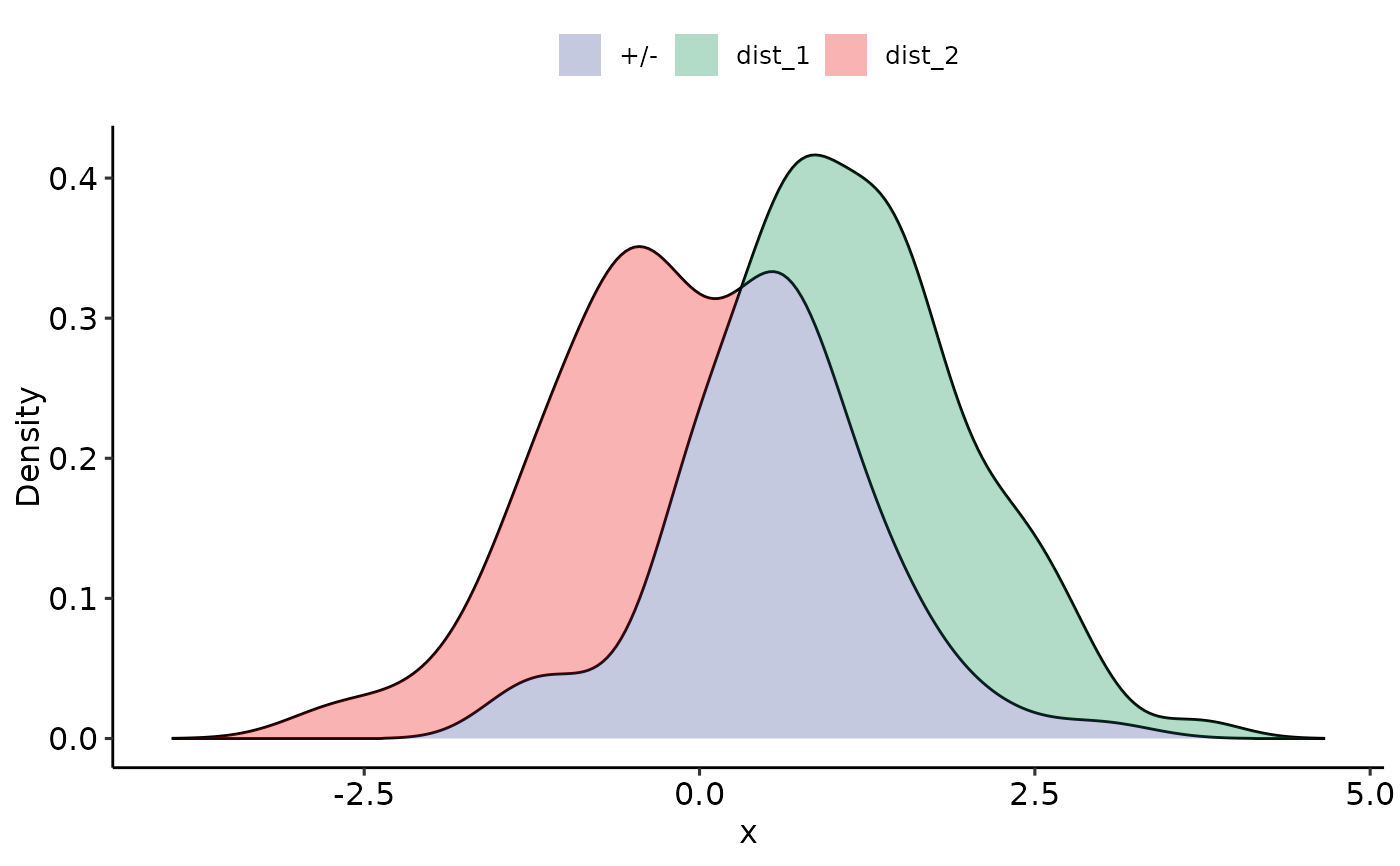
Plot empirical densities kernel estimate
plot_density_empirical.RdIf more than 2 list elements or data.frame columns, NotImplemented error.
Usage
plot_density_empirical(
  df,
  xmin = NULL,
  xmax = NULL,
  n_density = 512,
  length.out = 250,
  colors_pos_neg_both = colors_pos_neg_both_default,
  positive_label = NULL,
  ...
)
Arguments
- df
data.frame or list of values. The names will be the legends, the values will be used to estimate the densities.
- xmin
If given, the densities are restricted/shown from this value on
- xmax
If given, the densities are restricted/shown until this value
- n_density
Parameter of
density(), from that documentation: The number of equally spaced points at which the density is to be estimated. When n > 512, it is rounded up to a power of 2 during the calculations (as fft is used) and the final result is interpolated by approx. So it almost always makes sense to specify n as a power of two.- length.out
After calculating the density, how many values should be used to plot the density
- colors_pos_neg_both
Colors for positive ("+"), negative ("-") and overlapping "+/-" areas of the densities
- positive_label
If
positive_labelis given, set this as the "+" density.- ...
Convenience, not used in this function though.
