plot ROC including AUC significance
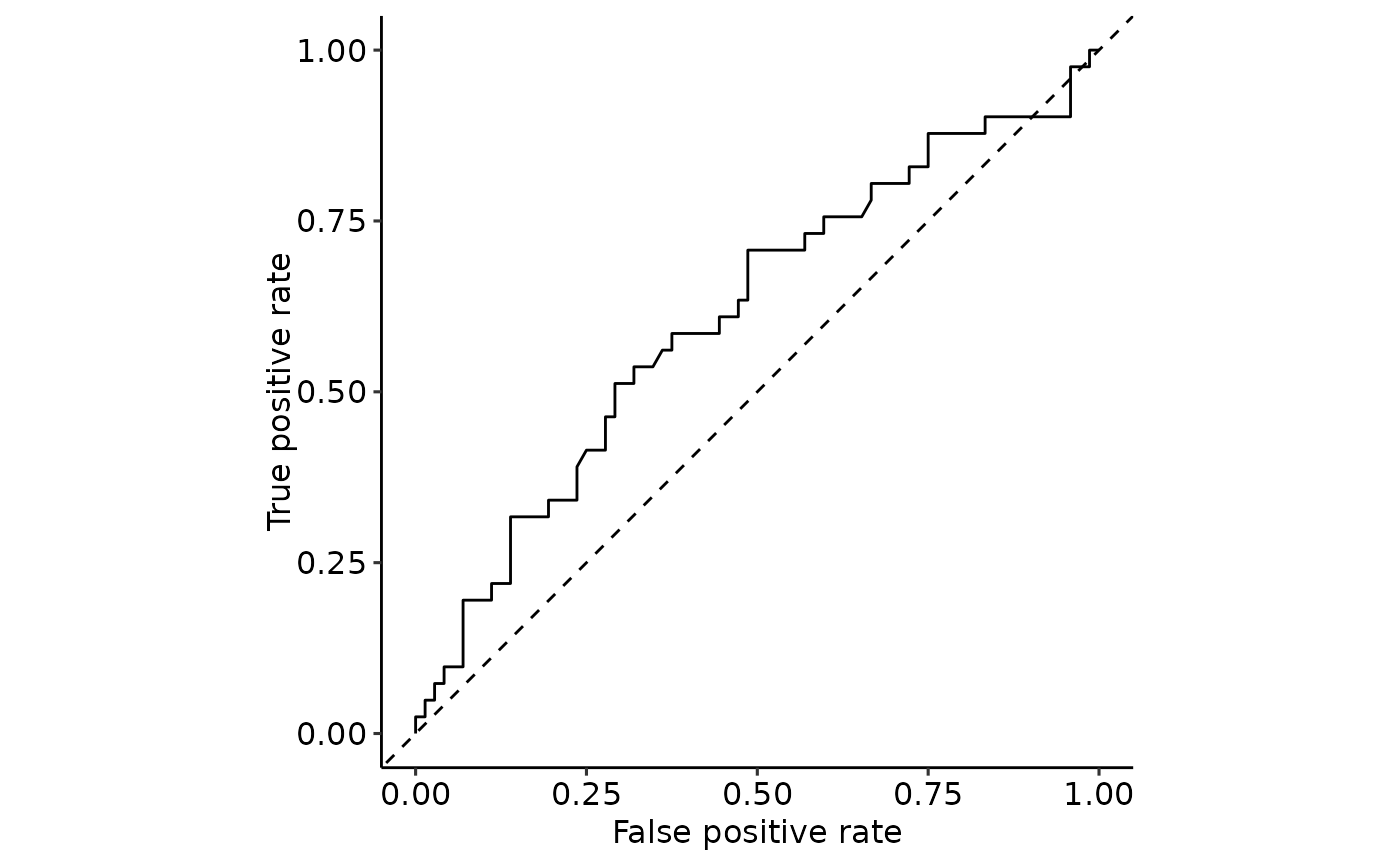
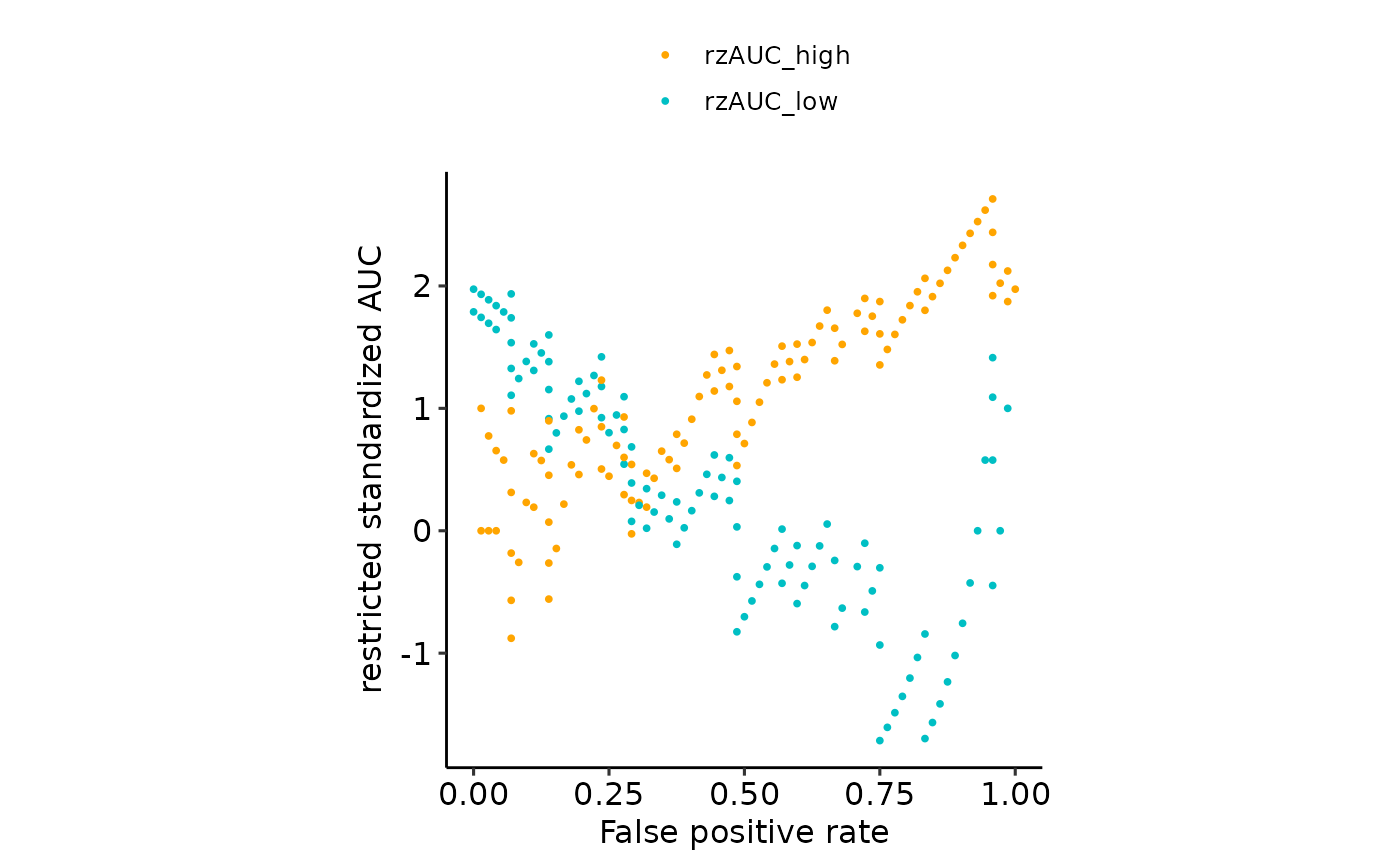
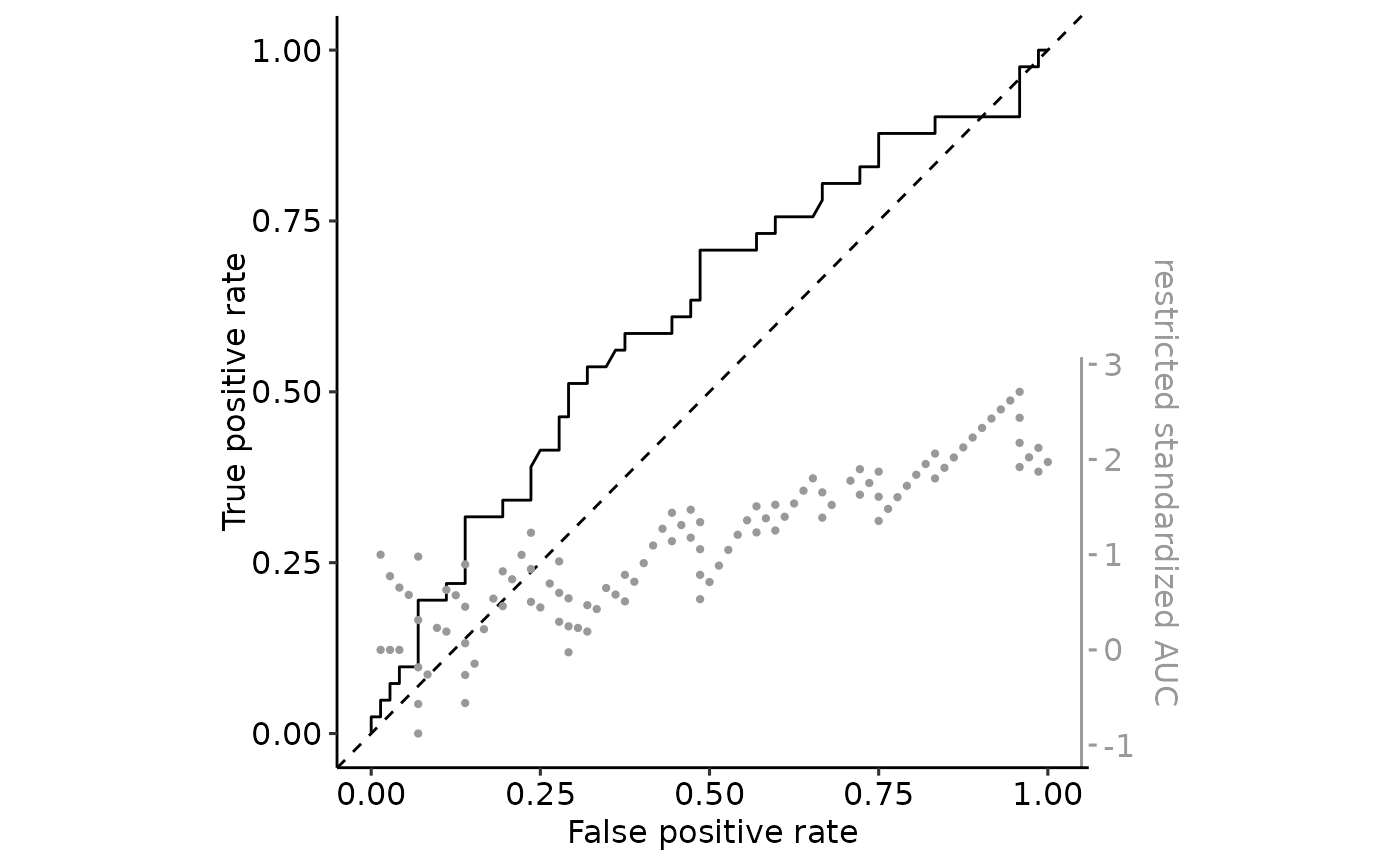
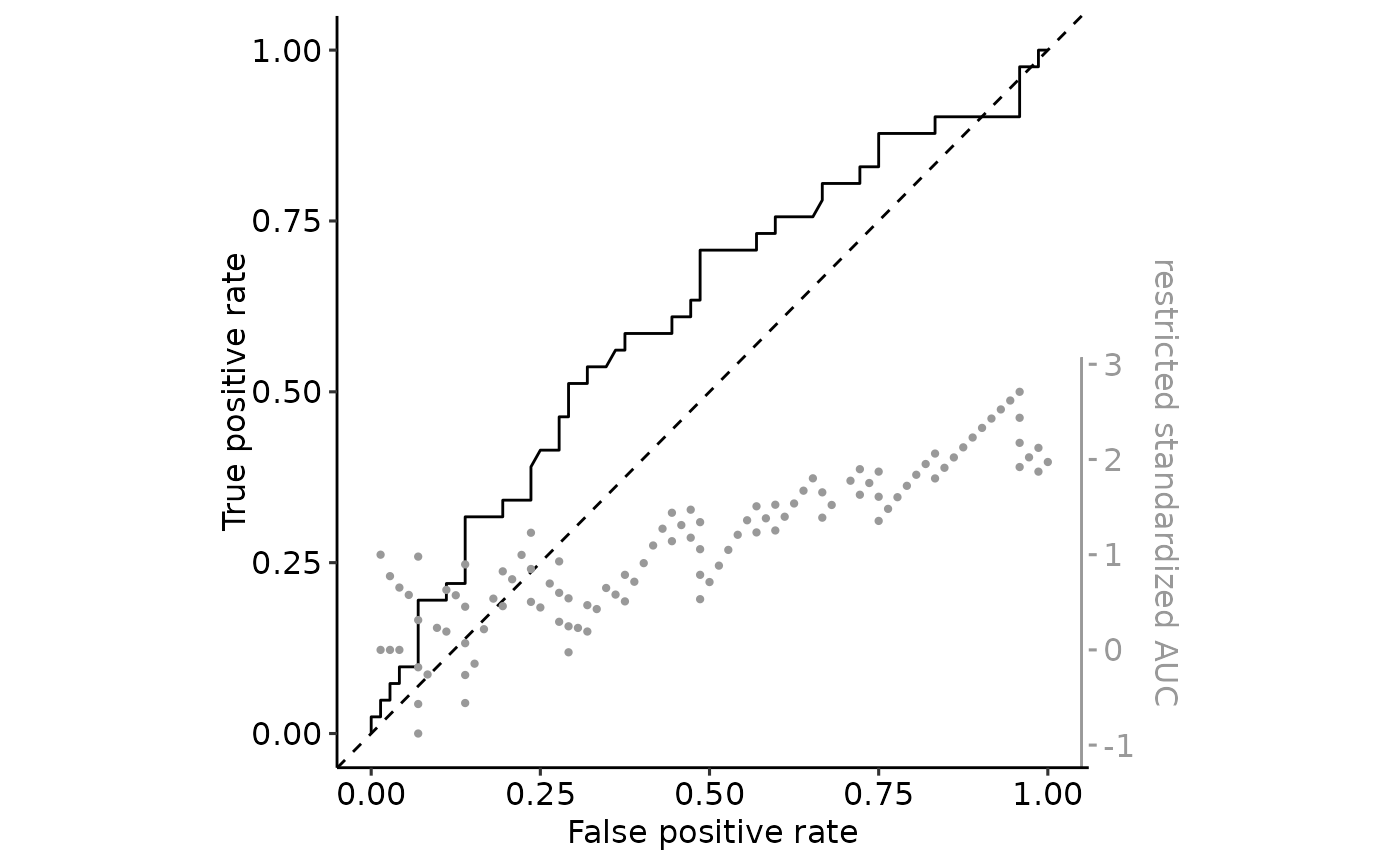
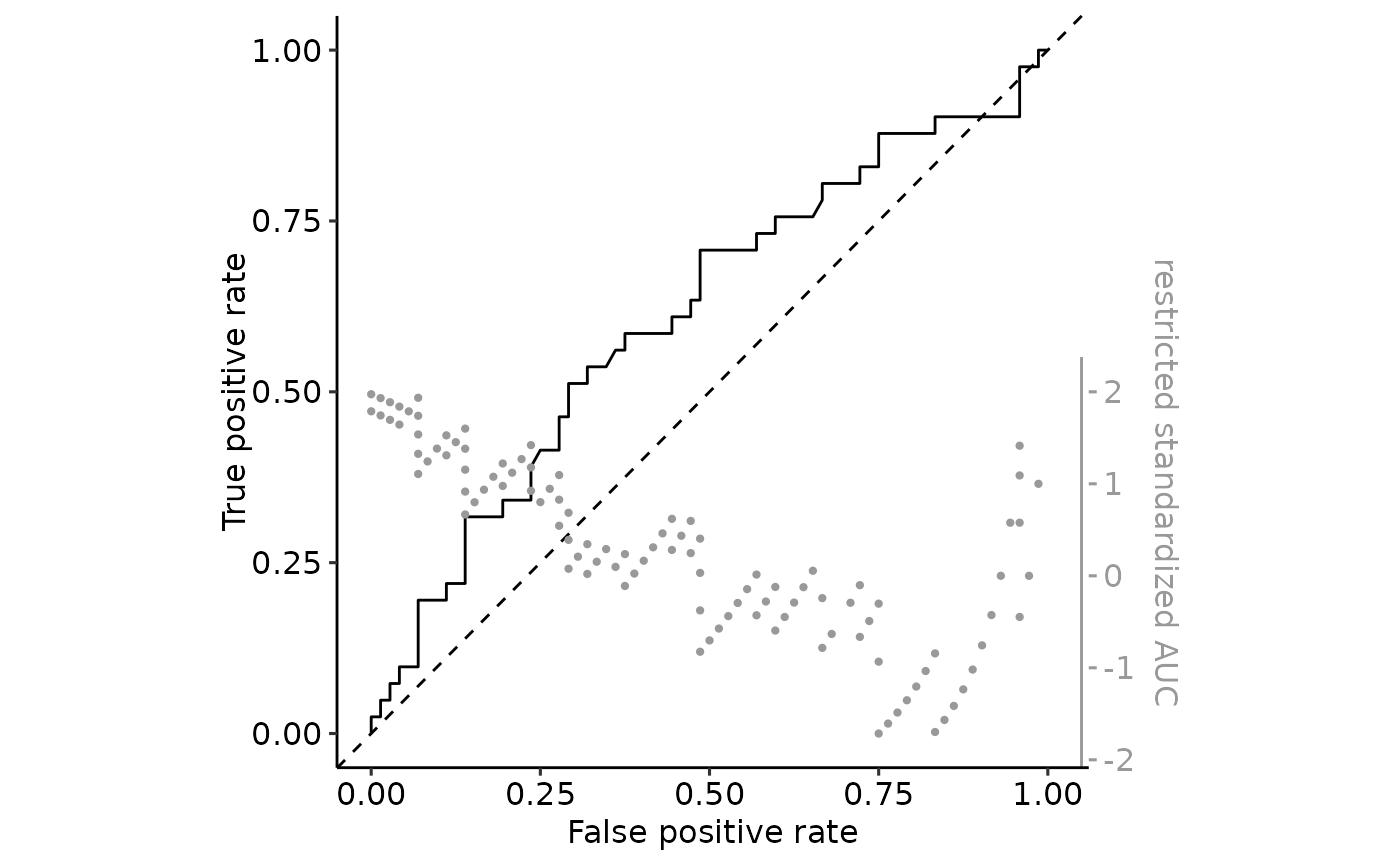
plot_rROC.RdPlot the complete ROC curve and the corresponding AUCs.
Usage
plot_rROC(
  x,
  col_rzAUC = "#999999",
  part = c("high", "low"),
  part_colors = default_part_colors,
  split_roc_score = FALSE
)
Arguments
- x
rROC result from
simple_rROC,simple_rROC_interpretorrROC.- col_rzAUC
Color for rzAUC points if split_roc_score=FALSE
- part
"high", "low" or multiple
- part_colors
Colors for the
part- split_roc_score
Shoult the ROC score (rzAUC) be a separate plot ("TRUE") or inside the ROC curve plot ("FALSE")
Value
List of multiple ggplot elements, always "roc", if split_roc_score=TRUE also a single "rzAUC" plot
Examples
# See also test-plot_rROC()
data(aSAH, package = "pROC")
simple_rROC_res <- simple_rROC(
response = aSAH$outcome,
predictor = aSAH$ndka
)
#> Positive label not given, setting to last level of factor: Poor
single_rROC <- simple_rROC_interpret(simple_rROC_res)
plot_rROC(
single_rROC,
split_roc_score = TRUE
)
#> $roc
 #>
#> $rzAUC
#>
#> $rzAUC
 #>
plot_rROC(
single_rROC,
split_roc_score = FALSE
)
#> Warning: Multiple parts given, plot only the first (high)
#> $roc
#> Warning: All aesthetics have length 1, but the data has 110 rows.
#> ℹ Please consider using `annotate()` or provide this layer with data containing
#> a single row.
#>
plot_rROC(
single_rROC,
split_roc_score = FALSE
)
#> Warning: Multiple parts given, plot only the first (high)
#> $roc
#> Warning: All aesthetics have length 1, but the data has 110 rows.
#> ℹ Please consider using `annotate()` or provide this layer with data containing
#> a single row.
 #>
plot_rROC(
single_rROC,
split_roc_score = FALSE,
part = "high"
)
#> $roc
#> Warning: All aesthetics have length 1, but the data has 110 rows.
#> ℹ Please consider using `annotate()` or provide this layer with data containing
#> a single row.
#>
plot_rROC(
single_rROC,
split_roc_score = FALSE,
part = "high"
)
#> $roc
#> Warning: All aesthetics have length 1, but the data has 110 rows.
#> ℹ Please consider using `annotate()` or provide this layer with data containing
#> a single row.
 #>
plot_rROC(
single_rROC,
split_roc_score = FALSE,
part = "low"
)
#> $roc
#> Warning: All aesthetics have length 1, but the data has 110 rows.
#> ℹ Please consider using `annotate()` or provide this layer with data containing
#> a single row.
#>
plot_rROC(
single_rROC,
split_roc_score = FALSE,
part = "low"
)
#> $roc
#> Warning: All aesthetics have length 1, but the data has 110 rows.
#> ℹ Please consider using `annotate()` or provide this layer with data containing
#> a single row.
 #>
#>