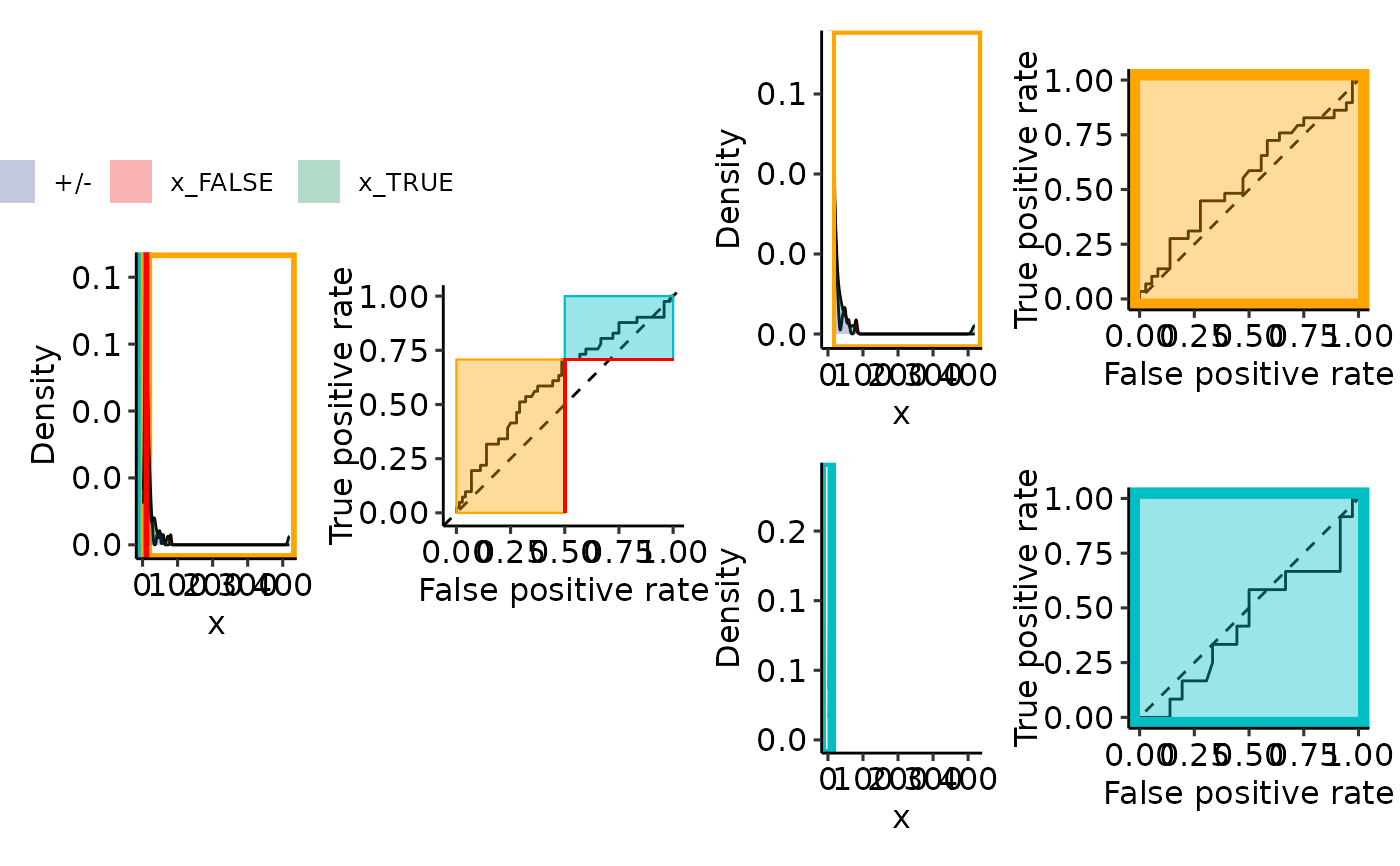
Plot (restricted) ROC curves
plot_rROC_part.RdPlot for every tpr/fpr combination:
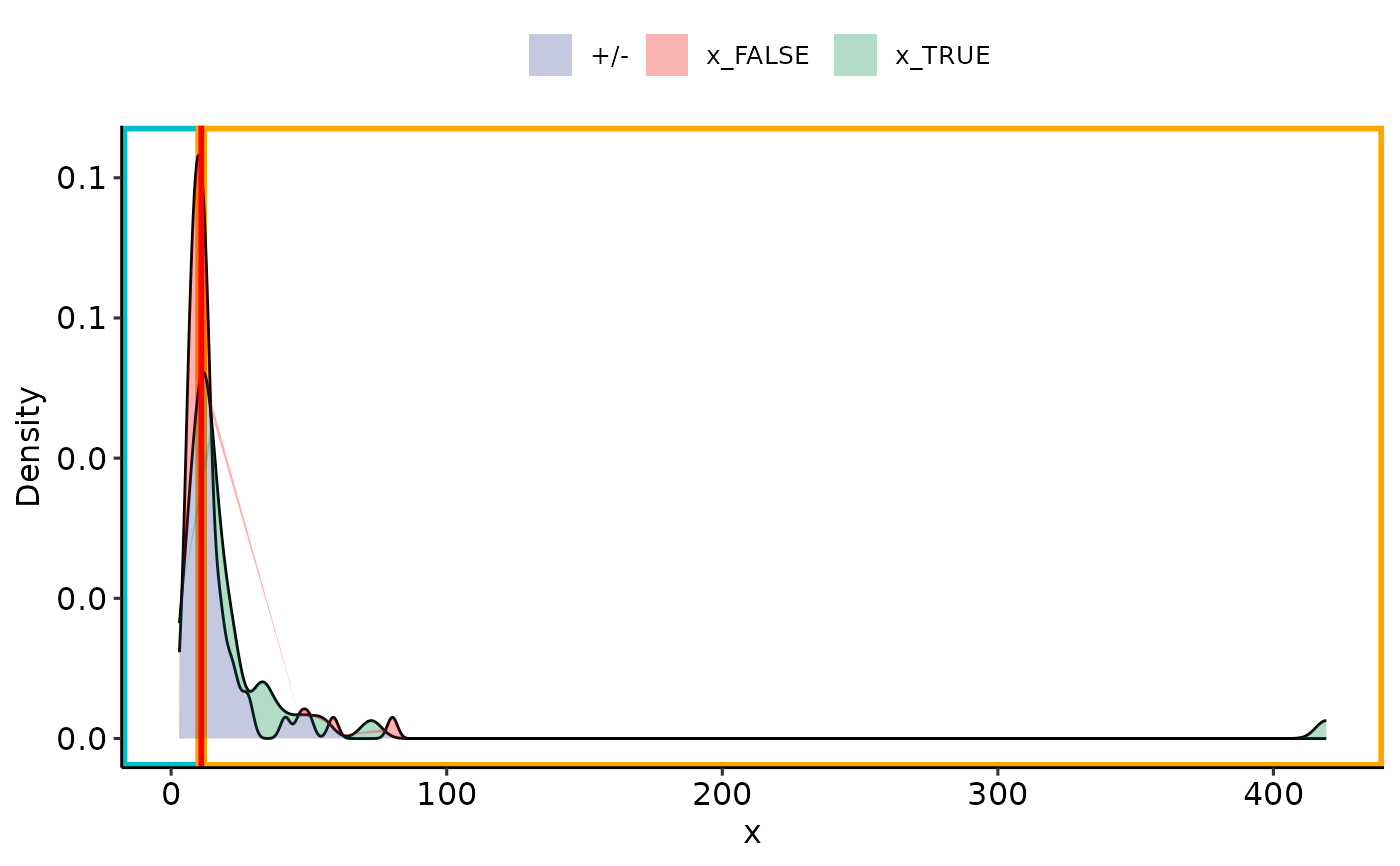
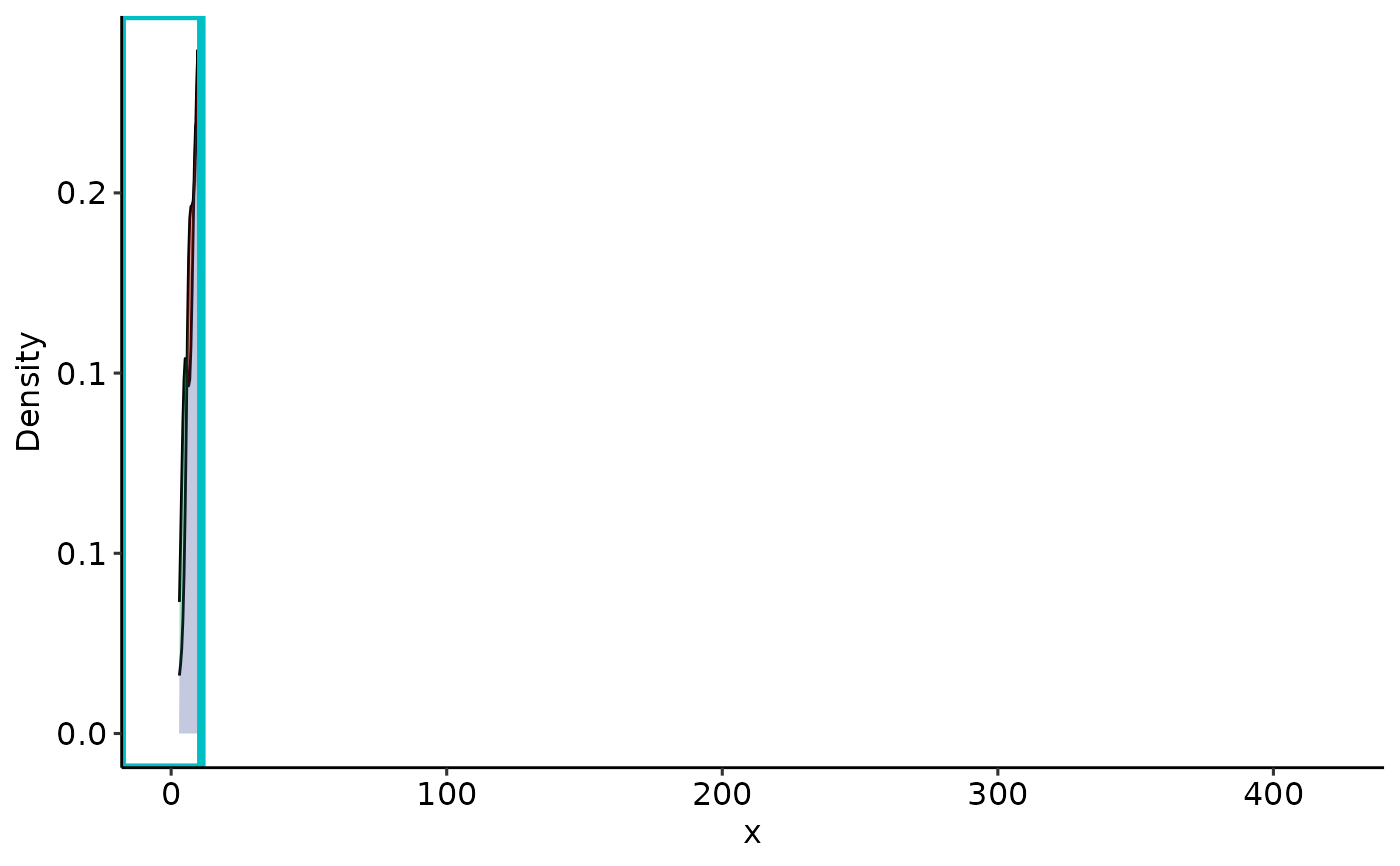
Full density
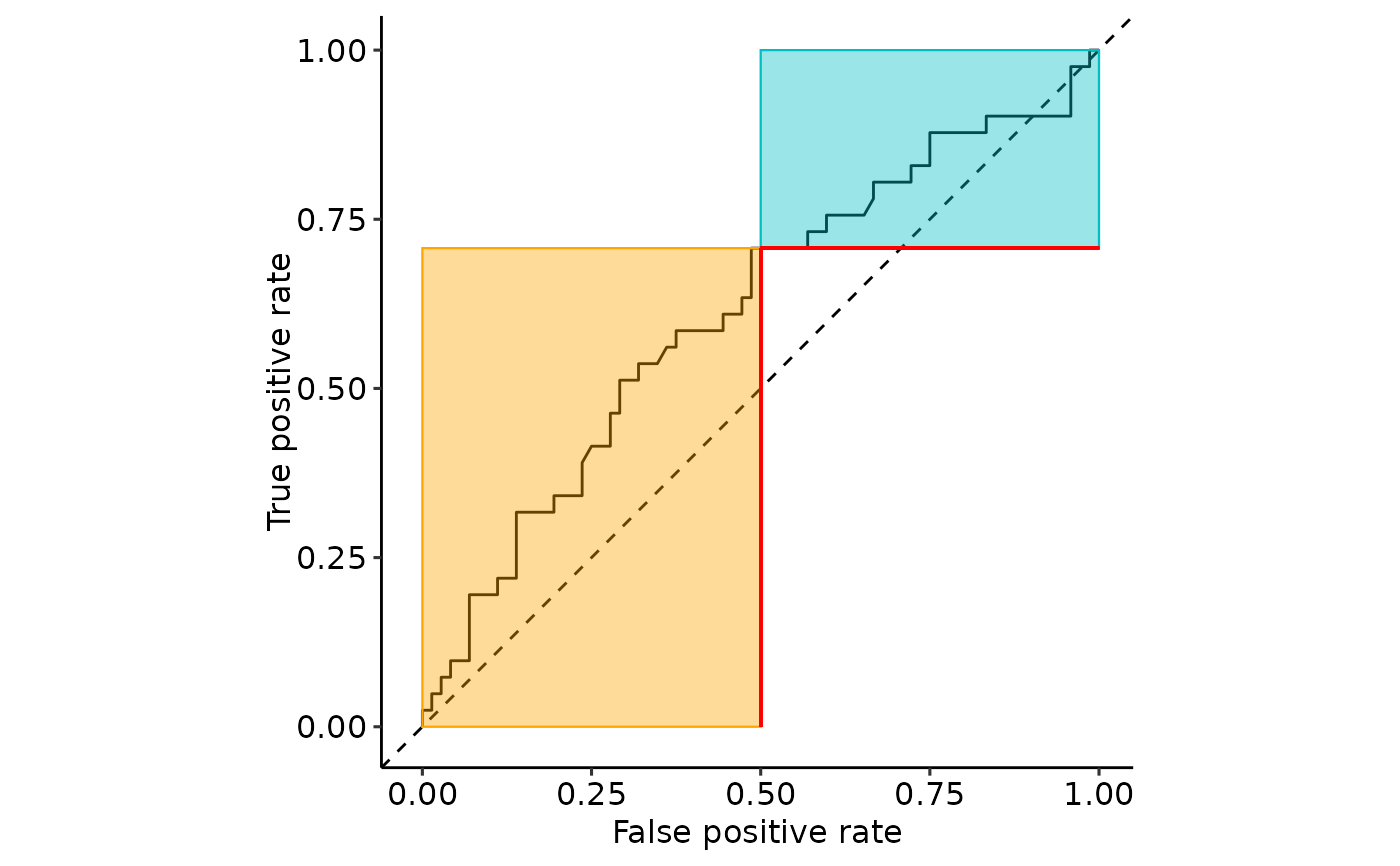
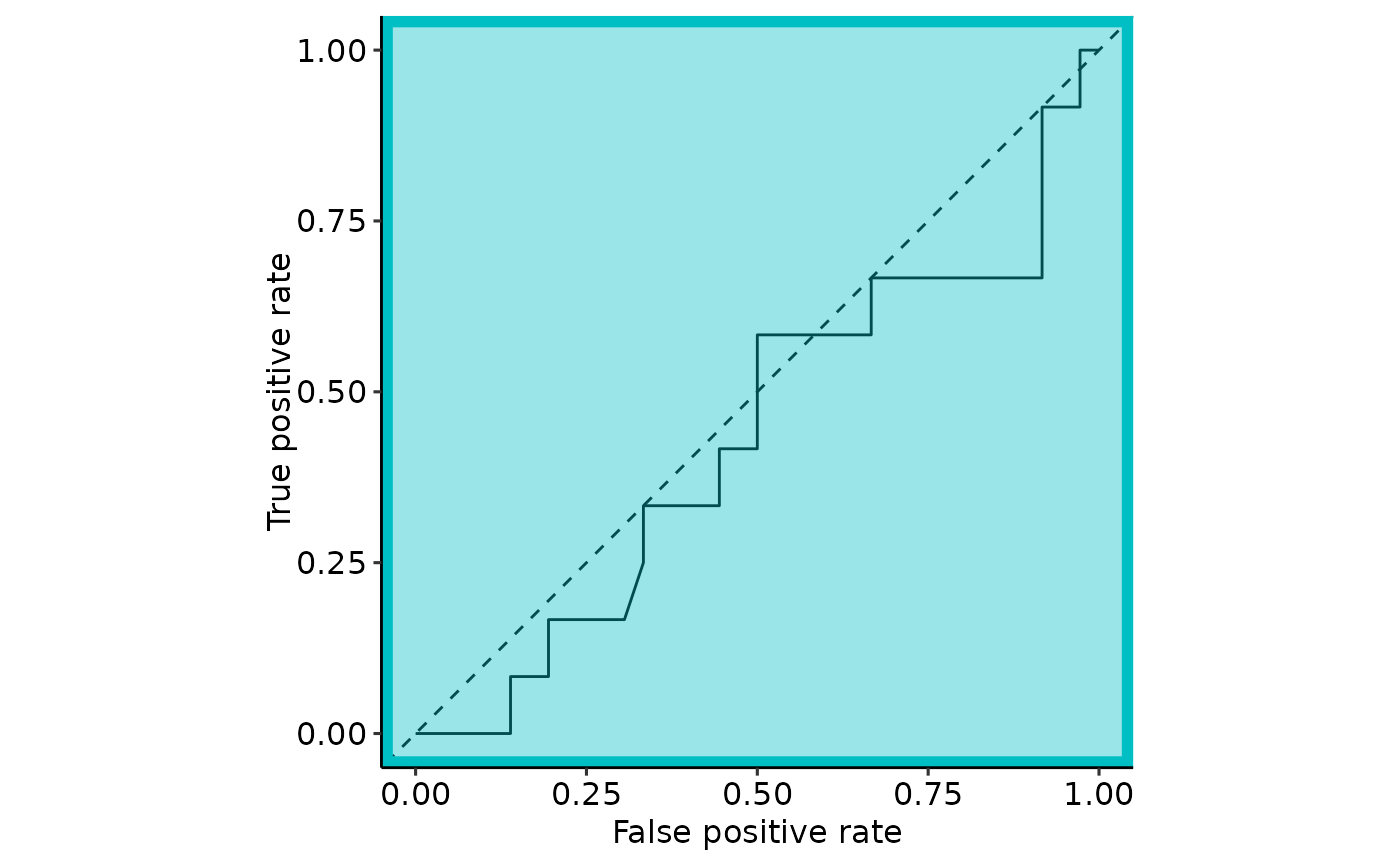
Full ROC + selection rectangles (orange + blue) + Full AUC + orange+blue partial AUCs + scaling factor + name rectangle sides + orange+blue partial AUCs SCALED
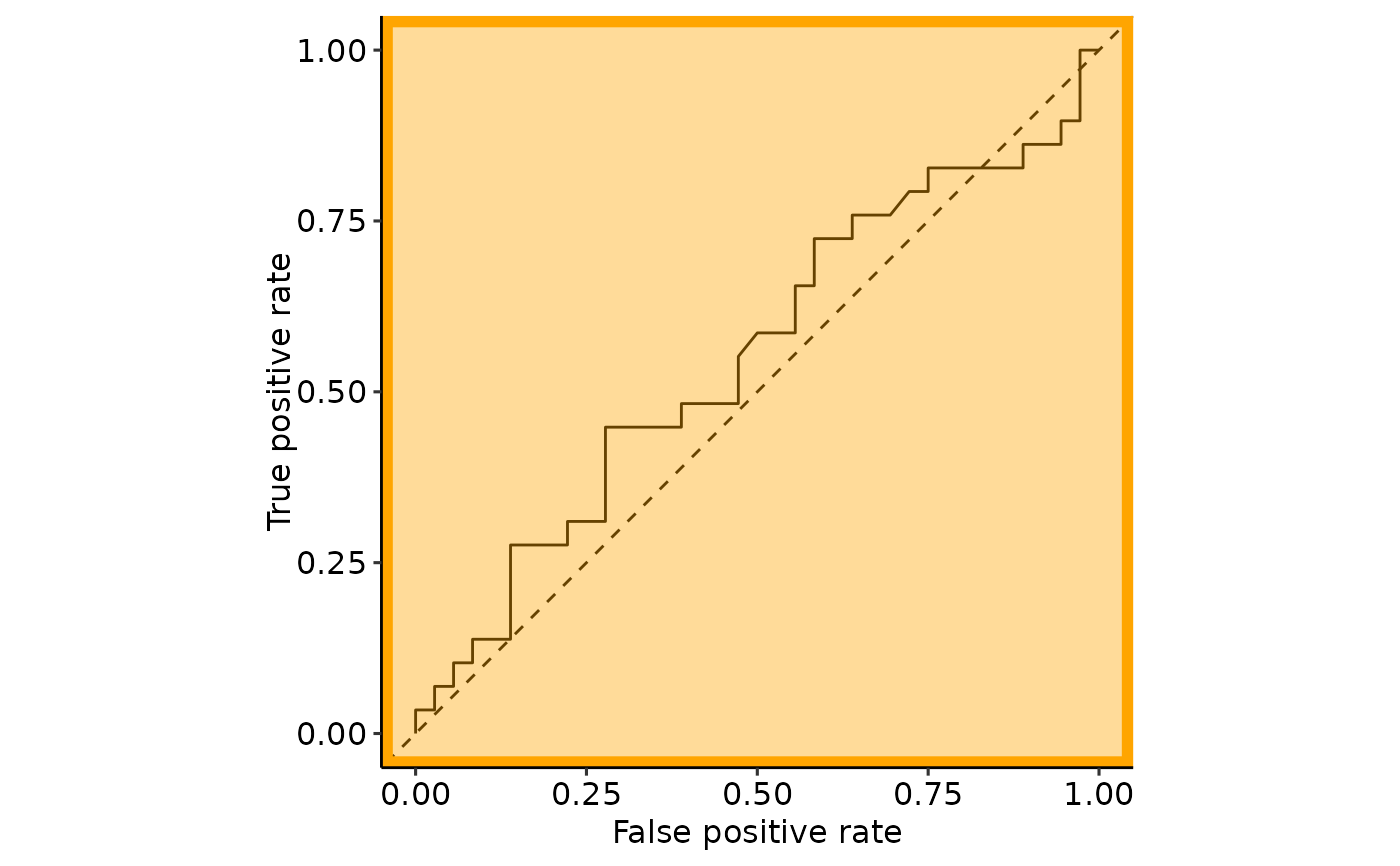
ROCs for selections + Full AUCs + Color rectangle around the plot
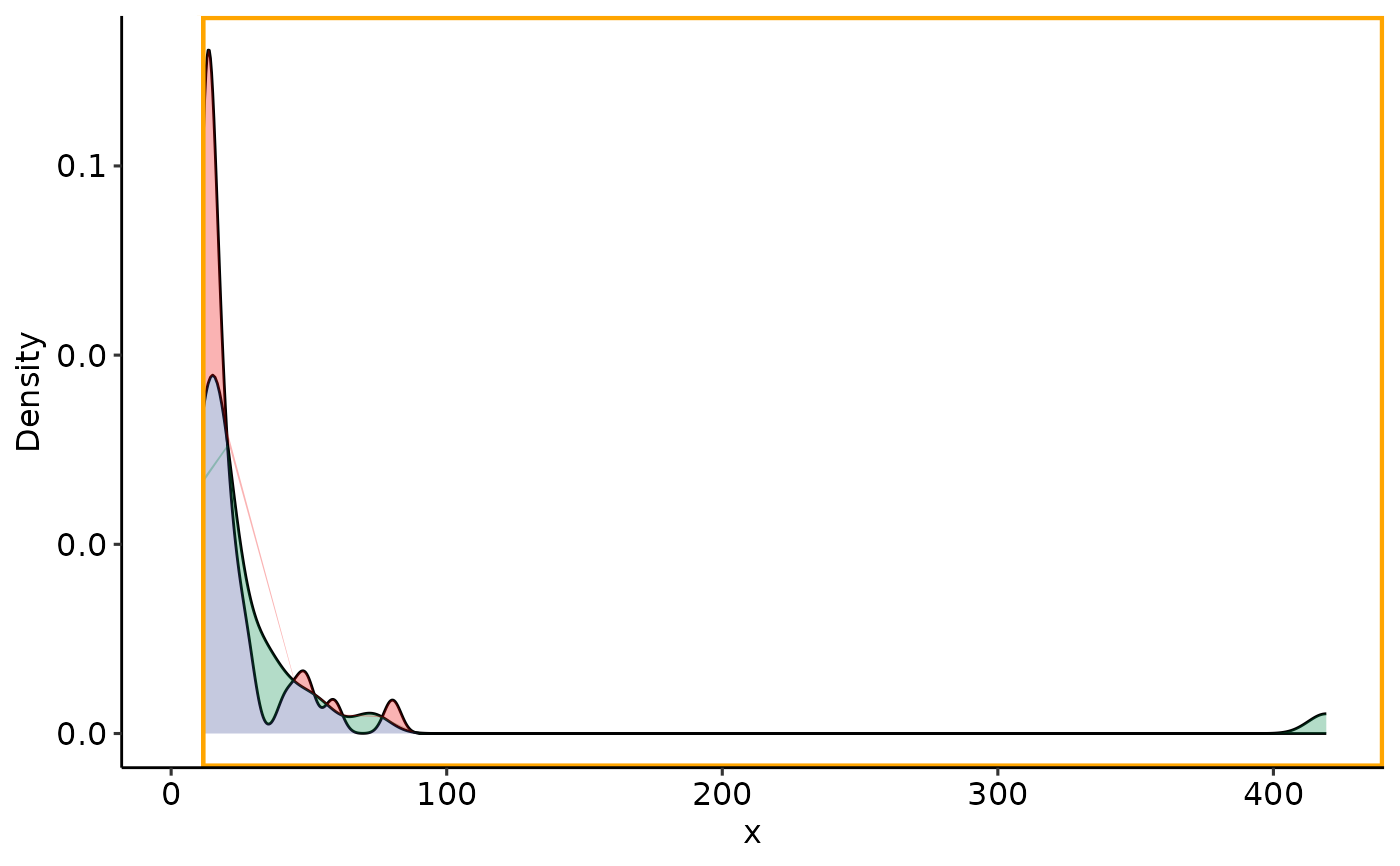
Densities for selections
Usage
plot_rROC_part(
  x,
  p_full_density_ROC = NA,
  threshold = NA,
  fpr = NA,
  color_high = default_part_colors["high"],
  color_low = default_part_colors["low"],
  include_part_auc_text = FALSE
)
Arguments
- x
rROC result including full_pROC.
- p_full_density_ROC
Density plot from plot_density_ROC_empirical of the full data, if not given it is calculated from rROC_res
- threshold
At which threshold should be split into high and low. Alternatively, give a false positive rate (fpr)
- fpr
A false positive rate at which (approximately) the cutoff will be made
- color_high
Color for high part
- color_low
Color for low part
- include_part_auc_text
Should the text-annotations be added or not?
Value
patchwork::patchworked plots, see the description.
Examples
library(restrictedROC)
data(aSAH, package = "pROC")
ret_procs <- simple_rROC(
response = aSAH$outcome,
predictor = aSAH$ndka,
return_proc = TRUE
)
#> Positive label not given, setting to last level of factor: Poor
# pdf("removeme.pdf")
print(plot_rROC_part(ret_procs, fpr = .5))
#> $plotlist
#> $plotlist$A
#> Ignoring unknown labels:
#> • colour : ""
 #>
#> $plotlist$B
#>
#> $plotlist$B
 #>
#> $plotlist$C
#> Ignoring unknown labels:
#> • colour : ""
#>
#> $plotlist$C
#> Ignoring unknown labels:
#> • colour : ""
 #>
#> $plotlist$D
#>
#> $plotlist$D
 #>
#> $plotlist$E
#> Ignoring unknown labels:
#> • colour : ""
#>
#> $plotlist$E
#> Ignoring unknown labels:
#> • colour : ""
 #>
#> $plotlist$F
#>
#> $plotlist$F
 #>
#>
#> $patchworked
#> Ignoring unknown labels:
#> • colour : ""
#> Ignoring unknown labels:
#> • colour : ""
#> Ignoring unknown labels:
#> • colour : ""
#>
#>
#> $patchworked
#> Ignoring unknown labels:
#> • colour : ""
#> Ignoring unknown labels:
#> • colour : ""
#> Ignoring unknown labels:
#> • colour : ""
 #>
# dev.off()
#>
# dev.off()