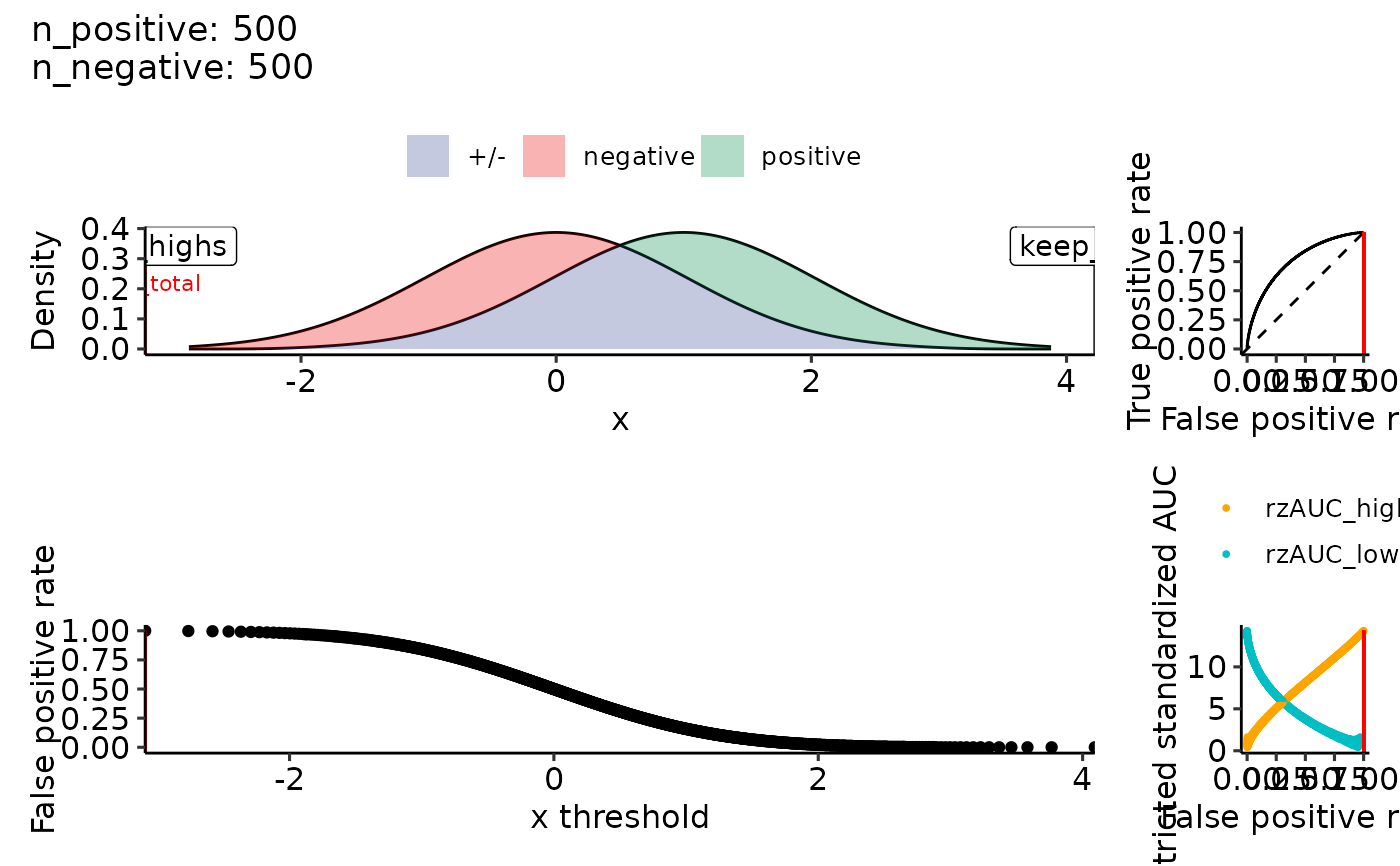
Plot (restricted) ROC curves for theoretic distributions
plot_rROC_theoretical.RdPlot (restricted) ROC curves for theoretic distributions
Usage
plot_rROC_theoretical(
  qnorm_positive,
  qnorm_negative,
  length.out_densityplot = 500,
  n_positive = 500,
  n_negative = 500,
  return_all = FALSE,
  ...
)
Arguments
- qnorm_positive
Quantile distribution function of positive class
- qnorm_negative
Quantile distribution function of negative class
- length.out_densityplot
Number of points to draw the density plot per curve
- n_positive
Number of positive samples.
- n_negative
Number of negative samples.
- return_all
If true, also return the rROC result, not only the plots
- ...
Further arguments to
plot_density_rROC_empirical()
