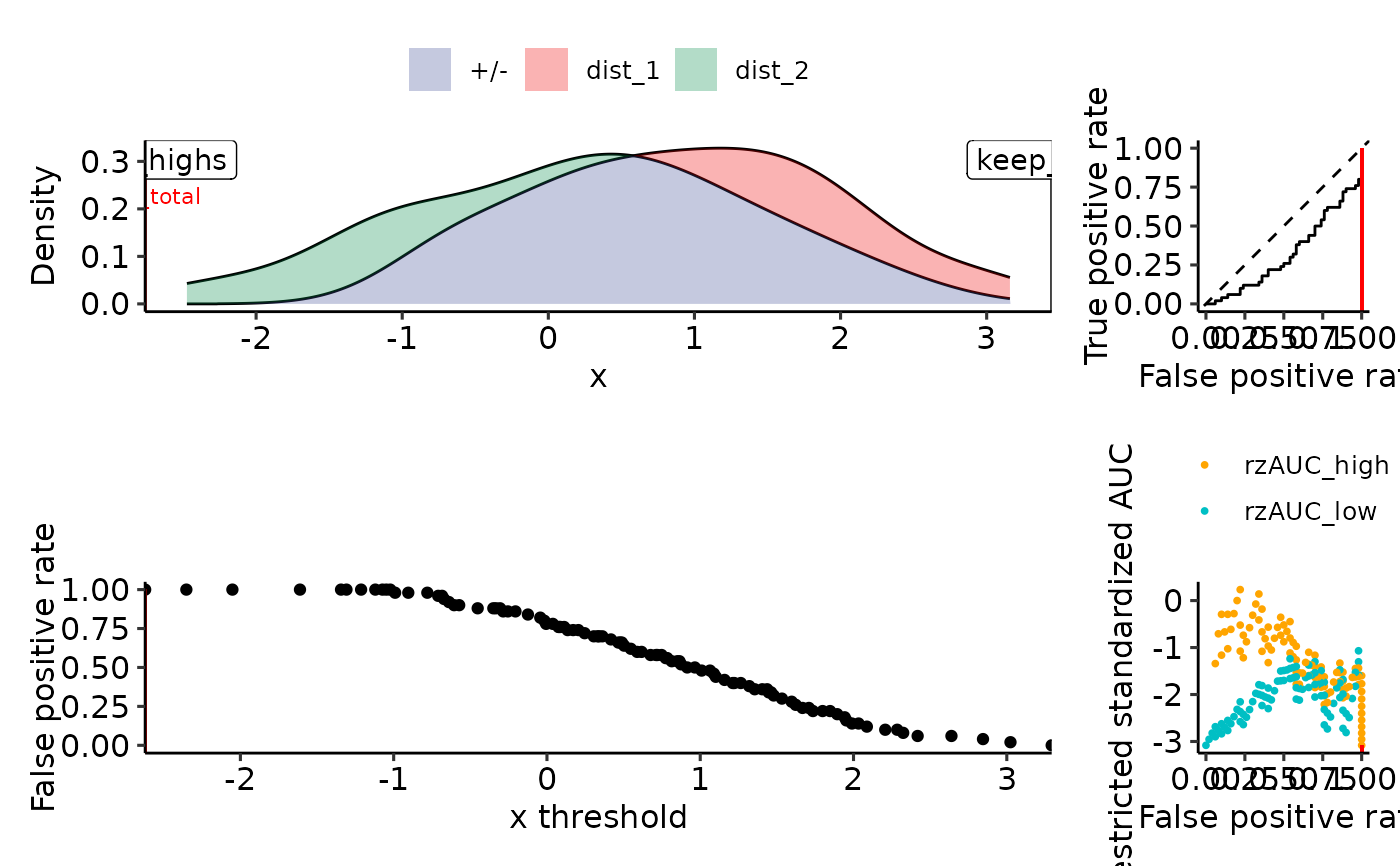
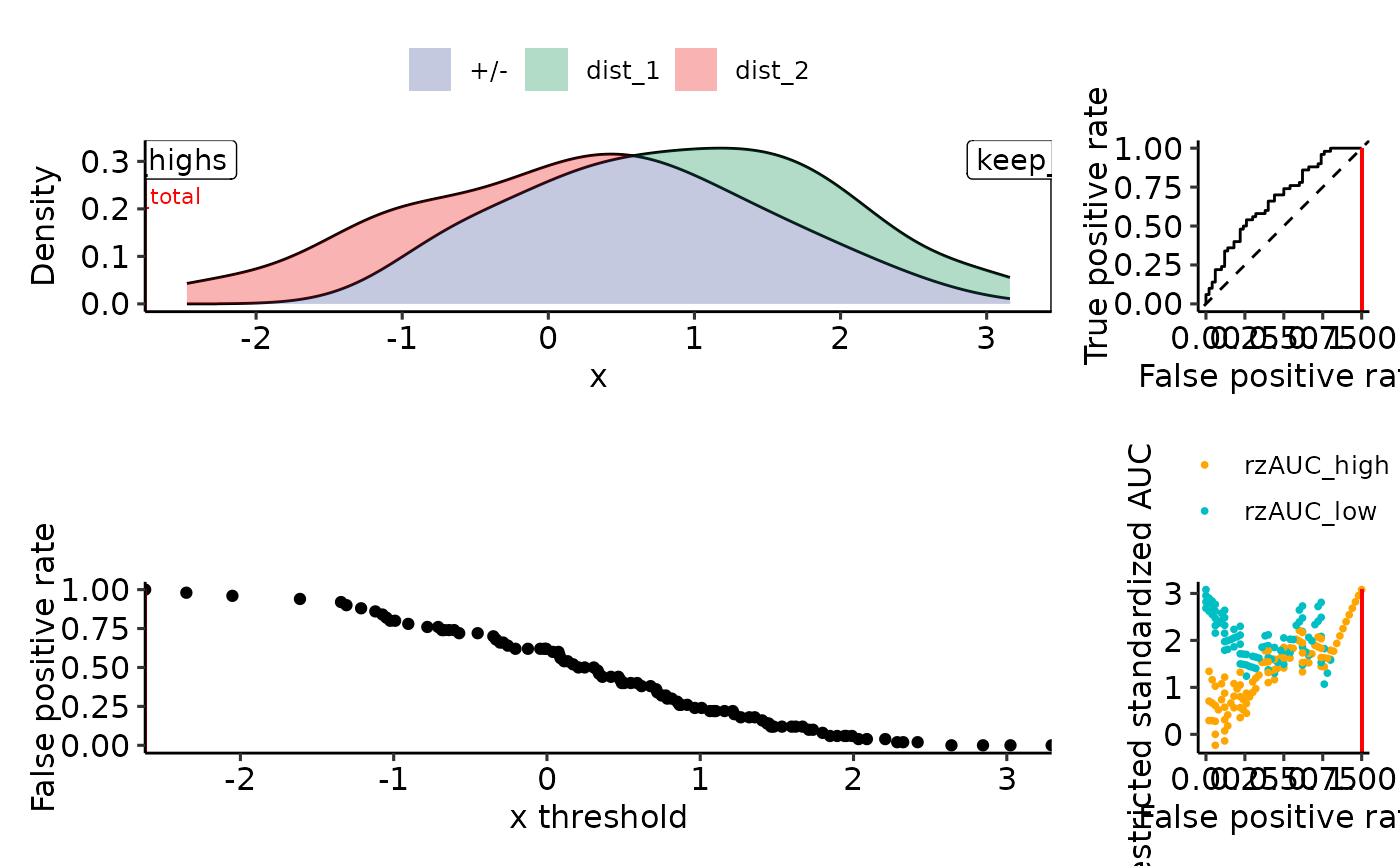
Plot 4 rROC plots
plot_density_rROC_empirical.RdUsage
plot_density_rROC_empirical(
  values_grouped,
  length.out = 500,
  xmin = NA,
  xmax = NA,
  single_rROC = NULL,
  positive_label = NULL,
  direction = "<",
  part_colors = default_part_colors,
  plot_thresholds = TRUE,
  plot_thresholds_fpr = TRUE,
  plot_n_points = NA
)
Arguments
- values_grouped
List-like element. (also data.frames or matrices) where the elements are the samples from the different distributions. E.g.: # A tibble: 1,000 × 2 dist_1 dist_2
1 0.974 0.257 2 0.196 -0.780 3 -0.125 -0.264 4 0.701 0.260 - length.out
See
plot_density_empirical(). Granularity of density plot (pure visualization).- xmin
- xmax
- single_rROC
Optional, if not given, rROC will be calculated on the fly.
- positive_label
Positive label for calculating ROC curve and the densities. If NULL, will be automatically generated from the data.
- direction
See
pROC::roc(), but only "<" implemented.- part_colors
Default: default_part_colors A vector c("high"=COLOR_A, "low"=COLOR_B) with colors for high-value (markerHIGH) and low-value (markerLOW) parts of calculating the restricted ROC.
- plot_thresholds
Plot the optimal restrictions for high/low part and the max_total (best overall)
- plot_thresholds_fpr
Plot the max_total threshold on plots B, C and D
- plot_n_points
Plot n random actual data points from each distribution with geom_jitter_scaling(). If NA, no points are plotted. To plot all points use Inf.
Examples
sim_samples <- sim(
list(
"dist_1" = function(x) rnorm(x, mean = 1, sd = 1),
"dist_2" = function(x) rnorm(x, mean = 0, sd = 1)
),
do_melt = FALSE,
length.out = 50
)
plot_density_rROC_empirical(sim_samples)
#> Positive label not given, setting to max(response): dist_2
#> $plots
#> Ignoring unknown labels:
#> • colour : ""
 #>
#> $single_rROC
#> $performances
#> # A tibble: 101 × 21
#> threshold auc_high positives_high negatives_high scaling_high auc_var_H0_high
#> <dbl> <dbl> <dbl> <dbl> <dbl> <dbl>
#> 1 -Inf 0.258 50 50 1 0.00337
#> 2 -2.35 0.264 49 50 1.02 0.00340
#> 3 -2.05 0.269 48 50 1.04 0.00344
#> 4 -1.61 0.275 47 50 1.06 0.00348
#> 5 -1.34 0.281 46 50 1.09 0.00351
#> 6 -1.31 0.287 45 50 1.11 0.00356
#> 7 -1.21 0.294 44 50 1.14 0.00360
#> 8 -1.12 0.300 43 50 1.16 0.00364
#> 9 -1.07 0.308 42 50 1.19 0.00369
#> 10 -1.05 0.315 41 50 1.22 0.00374
#> # ℹ 91 more rows
#> # ℹ 15 more variables: rzAUC_high <dbl>, pval_asym_onesided_high <dbl>,
#> # pval_asym_high <dbl>, auc_low <dbl>, positives_low <dbl>,
#> # negatives_low <dbl>, scaling_low <dbl>, auc_var_H0_low <dbl>,
#> # rzAUC_low <dbl>, pval_asym_onesided_low <dbl>, pval_asym_low <dbl>,
#> # tp <dbl>, fp <dbl>, tpr_global <dbl>, fpr_global <dbl>
#>
#> $global
#> auc auc_var_H0 rzAUC pval_asym
#> 1 0.2584 0.2584 -4.163867 3.129021e-05
#>
#> $keep_highs
#> auc auc_var_H0 rzAUC pval_asym threshold
#> 1 0.2584 0.003366667 -4.163867 3.129021e-05 -Inf
#>
#> $keep_lows
#> auc auc_var_H0 rzAUC pval_asym threshold
#> 1 0.2584 0.003366667 -4.163867 3.129021e-05 Inf
#>
#> $max_total
#> auc auc_var_H0 rzAUC pval_asym threshold part
#> 1 0.2584 0.003366667 -4.163867 3.129021e-05 -Inf global
#>
#> $positive_label
#> [1] "dist_2"
#>
#> $pROC_full
#>
#> Call:
#> roc.default(response = true_pred_df[["true"]], predictor = true_pred_df[["pred"]], levels = c(FALSE, TRUE), direction = direction)
#>
#> Data: true_pred_df[["pred"]] in 50 controls (true_pred_df[["true"]] FALSE) < 50 cases (true_pred_df[["true"]] TRUE).
#> Area under the curve: 0.2584
#>
#> attr(,"class")
#> [1] "restrictedROC" "list"
#>
plot_density_rROC_empirical(sim_samples, positive_label = "dist_1")
#> $plots
#> Ignoring unknown labels:
#> • colour : ""
#>
#> $single_rROC
#> $performances
#> # A tibble: 101 × 21
#> threshold auc_high positives_high negatives_high scaling_high auc_var_H0_high
#> <dbl> <dbl> <dbl> <dbl> <dbl> <dbl>
#> 1 -Inf 0.258 50 50 1 0.00337
#> 2 -2.35 0.264 49 50 1.02 0.00340
#> 3 -2.05 0.269 48 50 1.04 0.00344
#> 4 -1.61 0.275 47 50 1.06 0.00348
#> 5 -1.34 0.281 46 50 1.09 0.00351
#> 6 -1.31 0.287 45 50 1.11 0.00356
#> 7 -1.21 0.294 44 50 1.14 0.00360
#> 8 -1.12 0.300 43 50 1.16 0.00364
#> 9 -1.07 0.308 42 50 1.19 0.00369
#> 10 -1.05 0.315 41 50 1.22 0.00374
#> # ℹ 91 more rows
#> # ℹ 15 more variables: rzAUC_high <dbl>, pval_asym_onesided_high <dbl>,
#> # pval_asym_high <dbl>, auc_low <dbl>, positives_low <dbl>,
#> # negatives_low <dbl>, scaling_low <dbl>, auc_var_H0_low <dbl>,
#> # rzAUC_low <dbl>, pval_asym_onesided_low <dbl>, pval_asym_low <dbl>,
#> # tp <dbl>, fp <dbl>, tpr_global <dbl>, fpr_global <dbl>
#>
#> $global
#> auc auc_var_H0 rzAUC pval_asym
#> 1 0.2584 0.2584 -4.163867 3.129021e-05
#>
#> $keep_highs
#> auc auc_var_H0 rzAUC pval_asym threshold
#> 1 0.2584 0.003366667 -4.163867 3.129021e-05 -Inf
#>
#> $keep_lows
#> auc auc_var_H0 rzAUC pval_asym threshold
#> 1 0.2584 0.003366667 -4.163867 3.129021e-05 Inf
#>
#> $max_total
#> auc auc_var_H0 rzAUC pval_asym threshold part
#> 1 0.2584 0.003366667 -4.163867 3.129021e-05 -Inf global
#>
#> $positive_label
#> [1] "dist_2"
#>
#> $pROC_full
#>
#> Call:
#> roc.default(response = true_pred_df[["true"]], predictor = true_pred_df[["pred"]], levels = c(FALSE, TRUE), direction = direction)
#>
#> Data: true_pred_df[["pred"]] in 50 controls (true_pred_df[["true"]] FALSE) < 50 cases (true_pred_df[["true"]] TRUE).
#> Area under the curve: 0.2584
#>
#> attr(,"class")
#> [1] "restrictedROC" "list"
#>
plot_density_rROC_empirical(sim_samples, positive_label = "dist_1")
#> $plots
#> Ignoring unknown labels:
#> • colour : ""
 #>
#> $single_rROC
#> $performances
#> # A tibble: 101 × 21
#> threshold auc_high positives_high negatives_high scaling_high auc_var_H0_high
#> <dbl> <dbl> <dbl> <dbl> <dbl> <dbl>
#> 1 -Inf 0.742 50 50 1 0.00337
#> 2 -2.35 0.736 50 49 1.02 0.00340
#> 3 -2.05 0.731 50 48 1.04 0.00344
#> 4 -1.61 0.725 50 47 1.06 0.00348
#> 5 -1.34 0.719 50 46 1.09 0.00351
#> 6 -1.31 0.713 50 45 1.11 0.00356
#> 7 -1.21 0.706 50 44 1.14 0.00360
#> 8 -1.12 0.700 50 43 1.16 0.00364
#> 9 -1.07 0.692 50 42 1.19 0.00369
#> 10 -1.05 0.685 50 41 1.22 0.00374
#> # ℹ 91 more rows
#> # ℹ 15 more variables: rzAUC_high <dbl>, pval_asym_onesided_high <dbl>,
#> # pval_asym_high <dbl>, auc_low <dbl>, positives_low <dbl>,
#> # negatives_low <dbl>, scaling_low <dbl>, auc_var_H0_low <dbl>,
#> # rzAUC_low <dbl>, pval_asym_onesided_low <dbl>, pval_asym_low <dbl>,
#> # tp <dbl>, fp <dbl>, tpr_global <dbl>, fpr_global <dbl>
#>
#> $global
#> auc auc_var_H0 rzAUC pval_asym
#> 1 0.7416 0.7416 4.163867 3.129021e-05
#>
#> $keep_highs
#> auc auc_var_H0 rzAUC pval_asym threshold
#> 1 0.7416 0.003366667 4.163867 3.129021e-05 -Inf
#>
#> $keep_lows
#> auc auc_var_H0 rzAUC pval_asym threshold
#> 1 0.7416 0.003366667 4.163867 3.129021e-05 Inf
#>
#> $max_total
#> auc auc_var_H0 rzAUC pval_asym threshold part
#> 1 0.7416 0.003366667 4.163867 3.129021e-05 -Inf global
#>
#> $positive_label
#> [1] "dist_1"
#>
#> $pROC_full
#>
#> Call:
#> roc.default(response = true_pred_df[["true"]], predictor = true_pred_df[["pred"]], levels = c(FALSE, TRUE), direction = direction)
#>
#> Data: true_pred_df[["pred"]] in 50 controls (true_pred_df[["true"]] FALSE) < 50 cases (true_pred_df[["true"]] TRUE).
#> Area under the curve: 0.7416
#>
#> attr(,"class")
#> [1] "restrictedROC" "list"
#>
plot_density_rROC_empirical(sim_samples, positive_label = "dist_2")
#> $plots
#> Ignoring unknown labels:
#> • colour : ""
#>
#> $single_rROC
#> $performances
#> # A tibble: 101 × 21
#> threshold auc_high positives_high negatives_high scaling_high auc_var_H0_high
#> <dbl> <dbl> <dbl> <dbl> <dbl> <dbl>
#> 1 -Inf 0.742 50 50 1 0.00337
#> 2 -2.35 0.736 50 49 1.02 0.00340
#> 3 -2.05 0.731 50 48 1.04 0.00344
#> 4 -1.61 0.725 50 47 1.06 0.00348
#> 5 -1.34 0.719 50 46 1.09 0.00351
#> 6 -1.31 0.713 50 45 1.11 0.00356
#> 7 -1.21 0.706 50 44 1.14 0.00360
#> 8 -1.12 0.700 50 43 1.16 0.00364
#> 9 -1.07 0.692 50 42 1.19 0.00369
#> 10 -1.05 0.685 50 41 1.22 0.00374
#> # ℹ 91 more rows
#> # ℹ 15 more variables: rzAUC_high <dbl>, pval_asym_onesided_high <dbl>,
#> # pval_asym_high <dbl>, auc_low <dbl>, positives_low <dbl>,
#> # negatives_low <dbl>, scaling_low <dbl>, auc_var_H0_low <dbl>,
#> # rzAUC_low <dbl>, pval_asym_onesided_low <dbl>, pval_asym_low <dbl>,
#> # tp <dbl>, fp <dbl>, tpr_global <dbl>, fpr_global <dbl>
#>
#> $global
#> auc auc_var_H0 rzAUC pval_asym
#> 1 0.7416 0.7416 4.163867 3.129021e-05
#>
#> $keep_highs
#> auc auc_var_H0 rzAUC pval_asym threshold
#> 1 0.7416 0.003366667 4.163867 3.129021e-05 -Inf
#>
#> $keep_lows
#> auc auc_var_H0 rzAUC pval_asym threshold
#> 1 0.7416 0.003366667 4.163867 3.129021e-05 Inf
#>
#> $max_total
#> auc auc_var_H0 rzAUC pval_asym threshold part
#> 1 0.7416 0.003366667 4.163867 3.129021e-05 -Inf global
#>
#> $positive_label
#> [1] "dist_1"
#>
#> $pROC_full
#>
#> Call:
#> roc.default(response = true_pred_df[["true"]], predictor = true_pred_df[["pred"]], levels = c(FALSE, TRUE), direction = direction)
#>
#> Data: true_pred_df[["pred"]] in 50 controls (true_pred_df[["true"]] FALSE) < 50 cases (true_pred_df[["true"]] TRUE).
#> Area under the curve: 0.7416
#>
#> attr(,"class")
#> [1] "restrictedROC" "list"
#>
plot_density_rROC_empirical(sim_samples, positive_label = "dist_2")
#> $plots
#> Ignoring unknown labels:
#> • colour : ""
 #>
#> $single_rROC
#> $performances
#> # A tibble: 101 × 21
#> threshold auc_high positives_high negatives_high scaling_high auc_var_H0_high
#> <dbl> <dbl> <dbl> <dbl> <dbl> <dbl>
#> 1 -Inf 0.258 50 50 1 0.00337
#> 2 -2.35 0.264 49 50 1.02 0.00340
#> 3 -2.05 0.269 48 50 1.04 0.00344
#> 4 -1.61 0.275 47 50 1.06 0.00348
#> 5 -1.34 0.281 46 50 1.09 0.00351
#> 6 -1.31 0.287 45 50 1.11 0.00356
#> 7 -1.21 0.294 44 50 1.14 0.00360
#> 8 -1.12 0.300 43 50 1.16 0.00364
#> 9 -1.07 0.308 42 50 1.19 0.00369
#> 10 -1.05 0.315 41 50 1.22 0.00374
#> # ℹ 91 more rows
#> # ℹ 15 more variables: rzAUC_high <dbl>, pval_asym_onesided_high <dbl>,
#> # pval_asym_high <dbl>, auc_low <dbl>, positives_low <dbl>,
#> # negatives_low <dbl>, scaling_low <dbl>, auc_var_H0_low <dbl>,
#> # rzAUC_low <dbl>, pval_asym_onesided_low <dbl>, pval_asym_low <dbl>,
#> # tp <dbl>, fp <dbl>, tpr_global <dbl>, fpr_global <dbl>
#>
#> $global
#> auc auc_var_H0 rzAUC pval_asym
#> 1 0.2584 0.2584 -4.163867 3.129021e-05
#>
#> $keep_highs
#> auc auc_var_H0 rzAUC pval_asym threshold
#> 1 0.2584 0.003366667 -4.163867 3.129021e-05 -Inf
#>
#> $keep_lows
#> auc auc_var_H0 rzAUC pval_asym threshold
#> 1 0.2584 0.003366667 -4.163867 3.129021e-05 Inf
#>
#> $max_total
#> auc auc_var_H0 rzAUC pval_asym threshold part
#> 1 0.2584 0.003366667 -4.163867 3.129021e-05 -Inf global
#>
#> $positive_label
#> [1] "dist_2"
#>
#> $pROC_full
#>
#> Call:
#> roc.default(response = true_pred_df[["true"]], predictor = true_pred_df[["pred"]], levels = c(FALSE, TRUE), direction = direction)
#>
#> Data: true_pred_df[["pred"]] in 50 controls (true_pred_df[["true"]] FALSE) < 50 cases (true_pred_df[["true"]] TRUE).
#> Area under the curve: 0.2584
#>
#> attr(,"class")
#> [1] "restrictedROC" "list"
#>
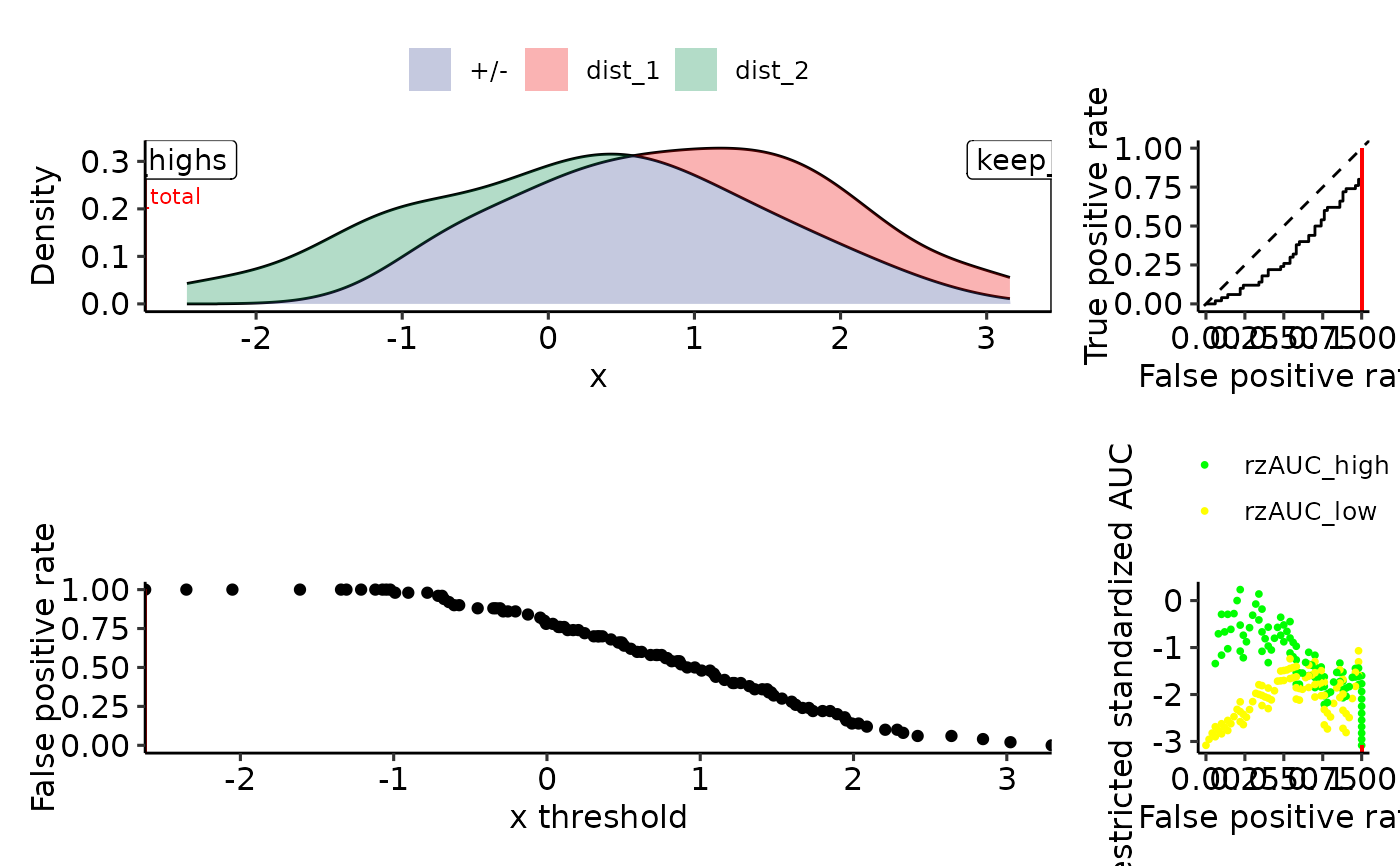
plot_density_rROC_empirical(sim_samples, part_colors = c("high" = "green", "low" = "yellow"))
#> Positive label not given, setting to max(response): dist_2
#> $plots
#> Ignoring unknown labels:
#> • colour : ""
#>
#> $single_rROC
#> $performances
#> # A tibble: 101 × 21
#> threshold auc_high positives_high negatives_high scaling_high auc_var_H0_high
#> <dbl> <dbl> <dbl> <dbl> <dbl> <dbl>
#> 1 -Inf 0.258 50 50 1 0.00337
#> 2 -2.35 0.264 49 50 1.02 0.00340
#> 3 -2.05 0.269 48 50 1.04 0.00344
#> 4 -1.61 0.275 47 50 1.06 0.00348
#> 5 -1.34 0.281 46 50 1.09 0.00351
#> 6 -1.31 0.287 45 50 1.11 0.00356
#> 7 -1.21 0.294 44 50 1.14 0.00360
#> 8 -1.12 0.300 43 50 1.16 0.00364
#> 9 -1.07 0.308 42 50 1.19 0.00369
#> 10 -1.05 0.315 41 50 1.22 0.00374
#> # ℹ 91 more rows
#> # ℹ 15 more variables: rzAUC_high <dbl>, pval_asym_onesided_high <dbl>,
#> # pval_asym_high <dbl>, auc_low <dbl>, positives_low <dbl>,
#> # negatives_low <dbl>, scaling_low <dbl>, auc_var_H0_low <dbl>,
#> # rzAUC_low <dbl>, pval_asym_onesided_low <dbl>, pval_asym_low <dbl>,
#> # tp <dbl>, fp <dbl>, tpr_global <dbl>, fpr_global <dbl>
#>
#> $global
#> auc auc_var_H0 rzAUC pval_asym
#> 1 0.2584 0.2584 -4.163867 3.129021e-05
#>
#> $keep_highs
#> auc auc_var_H0 rzAUC pval_asym threshold
#> 1 0.2584 0.003366667 -4.163867 3.129021e-05 -Inf
#>
#> $keep_lows
#> auc auc_var_H0 rzAUC pval_asym threshold
#> 1 0.2584 0.003366667 -4.163867 3.129021e-05 Inf
#>
#> $max_total
#> auc auc_var_H0 rzAUC pval_asym threshold part
#> 1 0.2584 0.003366667 -4.163867 3.129021e-05 -Inf global
#>
#> $positive_label
#> [1] "dist_2"
#>
#> $pROC_full
#>
#> Call:
#> roc.default(response = true_pred_df[["true"]], predictor = true_pred_df[["pred"]], levels = c(FALSE, TRUE), direction = direction)
#>
#> Data: true_pred_df[["pred"]] in 50 controls (true_pred_df[["true"]] FALSE) < 50 cases (true_pred_df[["true"]] TRUE).
#> Area under the curve: 0.2584
#>
#> attr(,"class")
#> [1] "restrictedROC" "list"
#>
plot_density_rROC_empirical(sim_samples, part_colors = c("high" = "green", "low" = "yellow"))
#> Positive label not given, setting to max(response): dist_2
#> $plots
#> Ignoring unknown labels:
#> • colour : ""
 #>
#> $single_rROC
#> $performances
#> # A tibble: 101 × 21
#> threshold auc_high positives_high negatives_high scaling_high auc_var_H0_high
#> <dbl> <dbl> <dbl> <dbl> <dbl> <dbl>
#> 1 -Inf 0.258 50 50 1 0.00337
#> 2 -2.35 0.264 49 50 1.02 0.00340
#> 3 -2.05 0.269 48 50 1.04 0.00344
#> 4 -1.61 0.275 47 50 1.06 0.00348
#> 5 -1.34 0.281 46 50 1.09 0.00351
#> 6 -1.31 0.287 45 50 1.11 0.00356
#> 7 -1.21 0.294 44 50 1.14 0.00360
#> 8 -1.12 0.300 43 50 1.16 0.00364
#> 9 -1.07 0.308 42 50 1.19 0.00369
#> 10 -1.05 0.315 41 50 1.22 0.00374
#> # ℹ 91 more rows
#> # ℹ 15 more variables: rzAUC_high <dbl>, pval_asym_onesided_high <dbl>,
#> # pval_asym_high <dbl>, auc_low <dbl>, positives_low <dbl>,
#> # negatives_low <dbl>, scaling_low <dbl>, auc_var_H0_low <dbl>,
#> # rzAUC_low <dbl>, pval_asym_onesided_low <dbl>, pval_asym_low <dbl>,
#> # tp <dbl>, fp <dbl>, tpr_global <dbl>, fpr_global <dbl>
#>
#> $global
#> auc auc_var_H0 rzAUC pval_asym
#> 1 0.2584 0.2584 -4.163867 3.129021e-05
#>
#> $keep_highs
#> auc auc_var_H0 rzAUC pval_asym threshold
#> 1 0.2584 0.003366667 -4.163867 3.129021e-05 -Inf
#>
#> $keep_lows
#> auc auc_var_H0 rzAUC pval_asym threshold
#> 1 0.2584 0.003366667 -4.163867 3.129021e-05 Inf
#>
#> $max_total
#> auc auc_var_H0 rzAUC pval_asym threshold part
#> 1 0.2584 0.003366667 -4.163867 3.129021e-05 -Inf global
#>
#> $positive_label
#> [1] "dist_2"
#>
#> $pROC_full
#>
#> Call:
#> roc.default(response = true_pred_df[["true"]], predictor = true_pred_df[["pred"]], levels = c(FALSE, TRUE), direction = direction)
#>
#> Data: true_pred_df[["pred"]] in 50 controls (true_pred_df[["true"]] FALSE) < 50 cases (true_pred_df[["true"]] TRUE).
#> Area under the curve: 0.2584
#>
#> attr(,"class")
#> [1] "restrictedROC" "list"
#>
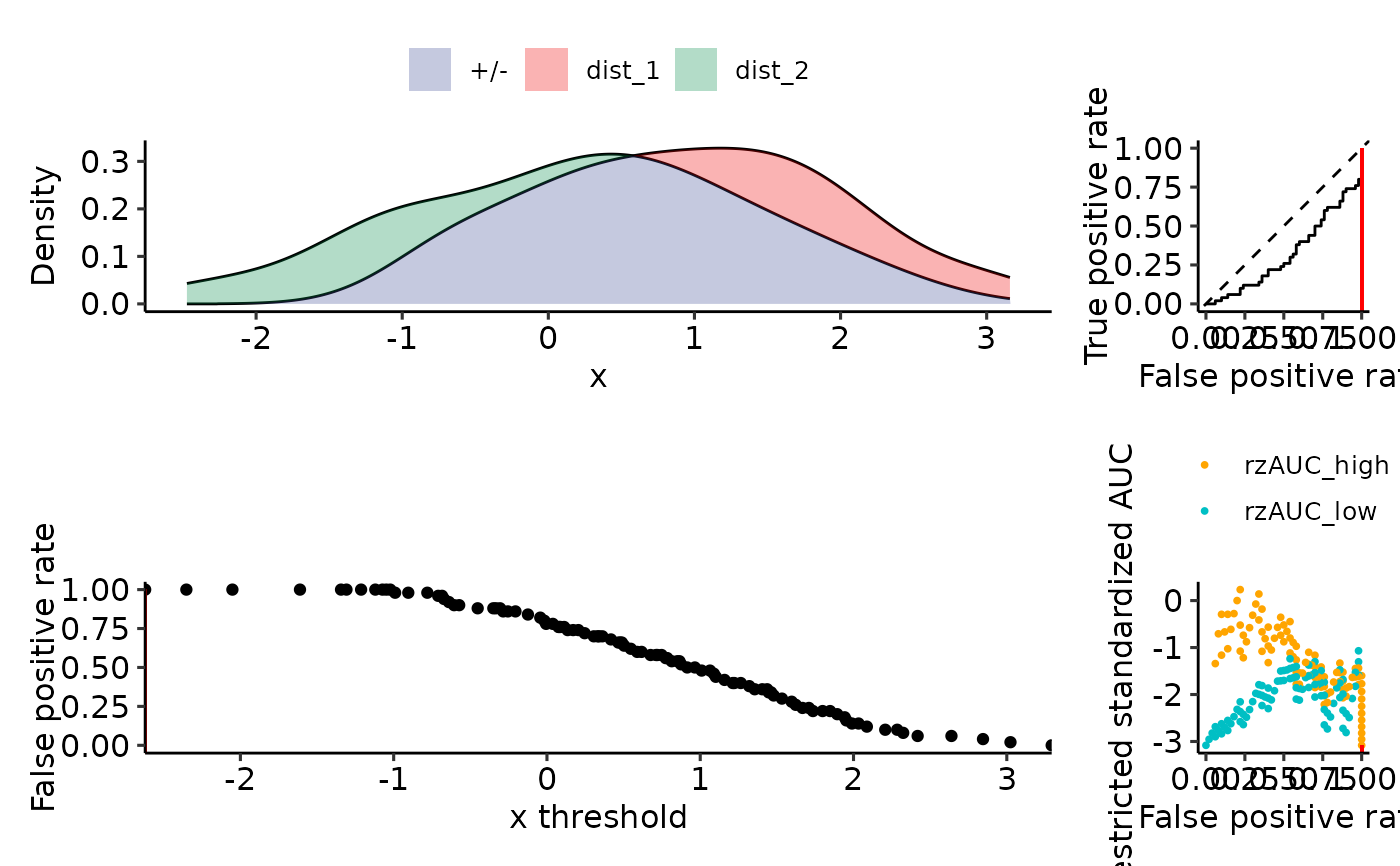
plot_density_rROC_empirical(sim_samples, plot_thresholds = FALSE)
#> Positive label not given, setting to max(response): dist_2
#> $plots
#> Ignoring unknown labels:
#> • colour : ""
#>
#> $single_rROC
#> $performances
#> # A tibble: 101 × 21
#> threshold auc_high positives_high negatives_high scaling_high auc_var_H0_high
#> <dbl> <dbl> <dbl> <dbl> <dbl> <dbl>
#> 1 -Inf 0.258 50 50 1 0.00337
#> 2 -2.35 0.264 49 50 1.02 0.00340
#> 3 -2.05 0.269 48 50 1.04 0.00344
#> 4 -1.61 0.275 47 50 1.06 0.00348
#> 5 -1.34 0.281 46 50 1.09 0.00351
#> 6 -1.31 0.287 45 50 1.11 0.00356
#> 7 -1.21 0.294 44 50 1.14 0.00360
#> 8 -1.12 0.300 43 50 1.16 0.00364
#> 9 -1.07 0.308 42 50 1.19 0.00369
#> 10 -1.05 0.315 41 50 1.22 0.00374
#> # ℹ 91 more rows
#> # ℹ 15 more variables: rzAUC_high <dbl>, pval_asym_onesided_high <dbl>,
#> # pval_asym_high <dbl>, auc_low <dbl>, positives_low <dbl>,
#> # negatives_low <dbl>, scaling_low <dbl>, auc_var_H0_low <dbl>,
#> # rzAUC_low <dbl>, pval_asym_onesided_low <dbl>, pval_asym_low <dbl>,
#> # tp <dbl>, fp <dbl>, tpr_global <dbl>, fpr_global <dbl>
#>
#> $global
#> auc auc_var_H0 rzAUC pval_asym
#> 1 0.2584 0.2584 -4.163867 3.129021e-05
#>
#> $keep_highs
#> auc auc_var_H0 rzAUC pval_asym threshold
#> 1 0.2584 0.003366667 -4.163867 3.129021e-05 -Inf
#>
#> $keep_lows
#> auc auc_var_H0 rzAUC pval_asym threshold
#> 1 0.2584 0.003366667 -4.163867 3.129021e-05 Inf
#>
#> $max_total
#> auc auc_var_H0 rzAUC pval_asym threshold part
#> 1 0.2584 0.003366667 -4.163867 3.129021e-05 -Inf global
#>
#> $positive_label
#> [1] "dist_2"
#>
#> $pROC_full
#>
#> Call:
#> roc.default(response = true_pred_df[["true"]], predictor = true_pred_df[["pred"]], levels = c(FALSE, TRUE), direction = direction)
#>
#> Data: true_pred_df[["pred"]] in 50 controls (true_pred_df[["true"]] FALSE) < 50 cases (true_pred_df[["true"]] TRUE).
#> Area under the curve: 0.2584
#>
#> attr(,"class")
#> [1] "restrictedROC" "list"
#>
plot_density_rROC_empirical(sim_samples, plot_thresholds = FALSE)
#> Positive label not given, setting to max(response): dist_2
#> $plots
#> Ignoring unknown labels:
#> • colour : ""
 #>
#> $single_rROC
#> $performances
#> # A tibble: 101 × 21
#> threshold auc_high positives_high negatives_high scaling_high auc_var_H0_high
#> <dbl> <dbl> <dbl> <dbl> <dbl> <dbl>
#> 1 -Inf 0.258 50 50 1 0.00337
#> 2 -2.35 0.264 49 50 1.02 0.00340
#> 3 -2.05 0.269 48 50 1.04 0.00344
#> 4 -1.61 0.275 47 50 1.06 0.00348
#> 5 -1.34 0.281 46 50 1.09 0.00351
#> 6 -1.31 0.287 45 50 1.11 0.00356
#> 7 -1.21 0.294 44 50 1.14 0.00360
#> 8 -1.12 0.300 43 50 1.16 0.00364
#> 9 -1.07 0.308 42 50 1.19 0.00369
#> 10 -1.05 0.315 41 50 1.22 0.00374
#> # ℹ 91 more rows
#> # ℹ 15 more variables: rzAUC_high <dbl>, pval_asym_onesided_high <dbl>,
#> # pval_asym_high <dbl>, auc_low <dbl>, positives_low <dbl>,
#> # negatives_low <dbl>, scaling_low <dbl>, auc_var_H0_low <dbl>,
#> # rzAUC_low <dbl>, pval_asym_onesided_low <dbl>, pval_asym_low <dbl>,
#> # tp <dbl>, fp <dbl>, tpr_global <dbl>, fpr_global <dbl>
#>
#> $global
#> auc auc_var_H0 rzAUC pval_asym
#> 1 0.2584 0.2584 -4.163867 3.129021e-05
#>
#> $keep_highs
#> auc auc_var_H0 rzAUC pval_asym threshold
#> 1 0.2584 0.003366667 -4.163867 3.129021e-05 -Inf
#>
#> $keep_lows
#> auc auc_var_H0 rzAUC pval_asym threshold
#> 1 0.2584 0.003366667 -4.163867 3.129021e-05 Inf
#>
#> $max_total
#> auc auc_var_H0 rzAUC pval_asym threshold part
#> 1 0.2584 0.003366667 -4.163867 3.129021e-05 -Inf global
#>
#> $positive_label
#> [1] "dist_2"
#>
#> $pROC_full
#>
#> Call:
#> roc.default(response = true_pred_df[["true"]], predictor = true_pred_df[["pred"]], levels = c(FALSE, TRUE), direction = direction)
#>
#> Data: true_pred_df[["pred"]] in 50 controls (true_pred_df[["true"]] FALSE) < 50 cases (true_pred_df[["true"]] TRUE).
#> Area under the curve: 0.2584
#>
#> attr(,"class")
#> [1] "restrictedROC" "list"
#>
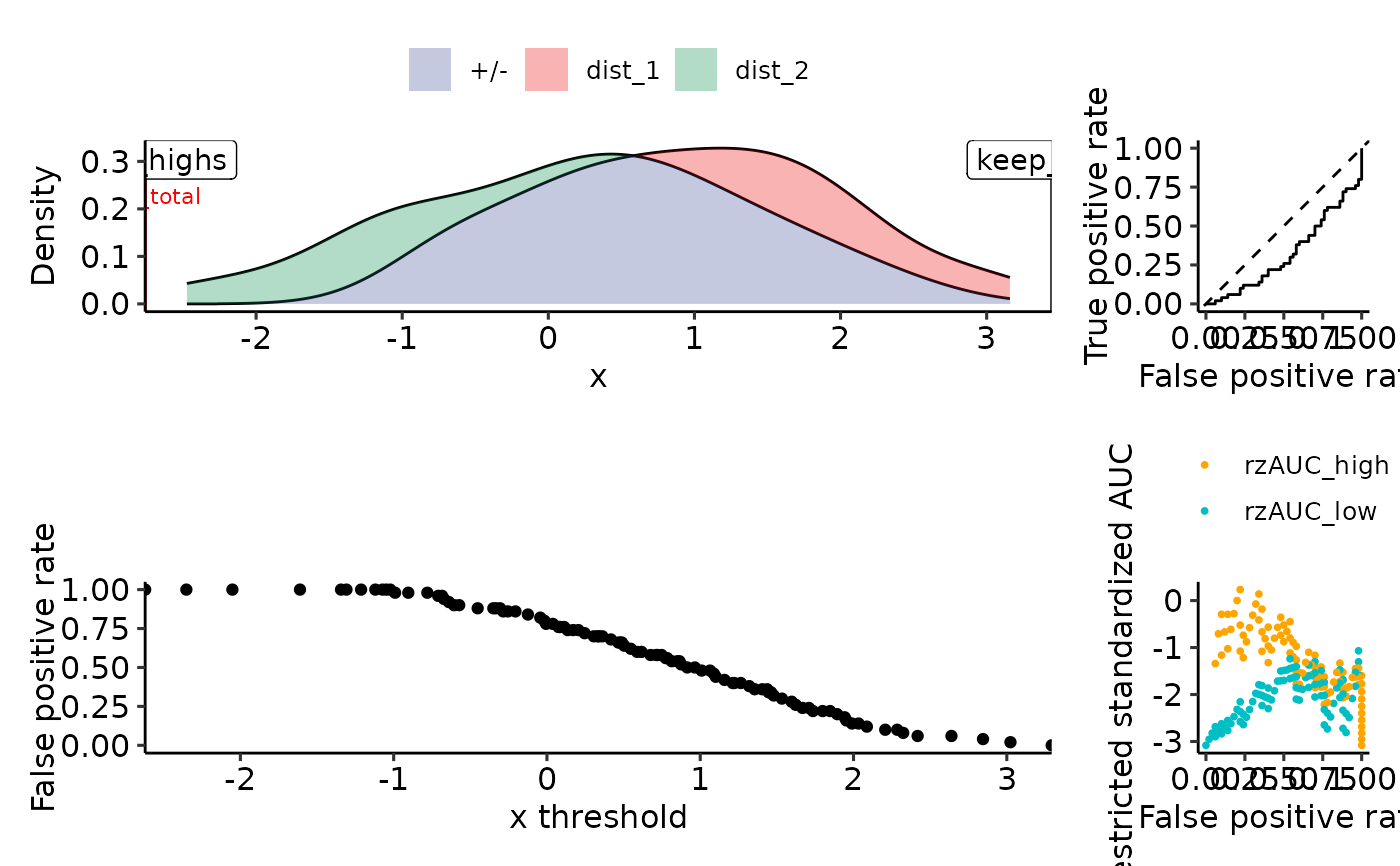
plot_density_rROC_empirical(sim_samples, plot_thresholds_fpr = FALSE)
#> Positive label not given, setting to max(response): dist_2
#> $plots
#> Ignoring unknown labels:
#> • colour : ""
#>
#> $single_rROC
#> $performances
#> # A tibble: 101 × 21
#> threshold auc_high positives_high negatives_high scaling_high auc_var_H0_high
#> <dbl> <dbl> <dbl> <dbl> <dbl> <dbl>
#> 1 -Inf 0.258 50 50 1 0.00337
#> 2 -2.35 0.264 49 50 1.02 0.00340
#> 3 -2.05 0.269 48 50 1.04 0.00344
#> 4 -1.61 0.275 47 50 1.06 0.00348
#> 5 -1.34 0.281 46 50 1.09 0.00351
#> 6 -1.31 0.287 45 50 1.11 0.00356
#> 7 -1.21 0.294 44 50 1.14 0.00360
#> 8 -1.12 0.300 43 50 1.16 0.00364
#> 9 -1.07 0.308 42 50 1.19 0.00369
#> 10 -1.05 0.315 41 50 1.22 0.00374
#> # ℹ 91 more rows
#> # ℹ 15 more variables: rzAUC_high <dbl>, pval_asym_onesided_high <dbl>,
#> # pval_asym_high <dbl>, auc_low <dbl>, positives_low <dbl>,
#> # negatives_low <dbl>, scaling_low <dbl>, auc_var_H0_low <dbl>,
#> # rzAUC_low <dbl>, pval_asym_onesided_low <dbl>, pval_asym_low <dbl>,
#> # tp <dbl>, fp <dbl>, tpr_global <dbl>, fpr_global <dbl>
#>
#> $global
#> auc auc_var_H0 rzAUC pval_asym
#> 1 0.2584 0.2584 -4.163867 3.129021e-05
#>
#> $keep_highs
#> auc auc_var_H0 rzAUC pval_asym threshold
#> 1 0.2584 0.003366667 -4.163867 3.129021e-05 -Inf
#>
#> $keep_lows
#> auc auc_var_H0 rzAUC pval_asym threshold
#> 1 0.2584 0.003366667 -4.163867 3.129021e-05 Inf
#>
#> $max_total
#> auc auc_var_H0 rzAUC pval_asym threshold part
#> 1 0.2584 0.003366667 -4.163867 3.129021e-05 -Inf global
#>
#> $positive_label
#> [1] "dist_2"
#>
#> $pROC_full
#>
#> Call:
#> roc.default(response = true_pred_df[["true"]], predictor = true_pred_df[["pred"]], levels = c(FALSE, TRUE), direction = direction)
#>
#> Data: true_pred_df[["pred"]] in 50 controls (true_pred_df[["true"]] FALSE) < 50 cases (true_pred_df[["true"]] TRUE).
#> Area under the curve: 0.2584
#>
#> attr(,"class")
#> [1] "restrictedROC" "list"
#>
plot_density_rROC_empirical(sim_samples, plot_thresholds_fpr = FALSE)
#> Positive label not given, setting to max(response): dist_2
#> $plots
#> Ignoring unknown labels:
#> • colour : ""
 #>
#> $single_rROC
#> $performances
#> # A tibble: 101 × 21
#> threshold auc_high positives_high negatives_high scaling_high auc_var_H0_high
#> <dbl> <dbl> <dbl> <dbl> <dbl> <dbl>
#> 1 -Inf 0.258 50 50 1 0.00337
#> 2 -2.35 0.264 49 50 1.02 0.00340
#> 3 -2.05 0.269 48 50 1.04 0.00344
#> 4 -1.61 0.275 47 50 1.06 0.00348
#> 5 -1.34 0.281 46 50 1.09 0.00351
#> 6 -1.31 0.287 45 50 1.11 0.00356
#> 7 -1.21 0.294 44 50 1.14 0.00360
#> 8 -1.12 0.300 43 50 1.16 0.00364
#> 9 -1.07 0.308 42 50 1.19 0.00369
#> 10 -1.05 0.315 41 50 1.22 0.00374
#> # ℹ 91 more rows
#> # ℹ 15 more variables: rzAUC_high <dbl>, pval_asym_onesided_high <dbl>,
#> # pval_asym_high <dbl>, auc_low <dbl>, positives_low <dbl>,
#> # negatives_low <dbl>, scaling_low <dbl>, auc_var_H0_low <dbl>,
#> # rzAUC_low <dbl>, pval_asym_onesided_low <dbl>, pval_asym_low <dbl>,
#> # tp <dbl>, fp <dbl>, tpr_global <dbl>, fpr_global <dbl>
#>
#> $global
#> auc auc_var_H0 rzAUC pval_asym
#> 1 0.2584 0.2584 -4.163867 3.129021e-05
#>
#> $keep_highs
#> auc auc_var_H0 rzAUC pval_asym threshold
#> 1 0.2584 0.003366667 -4.163867 3.129021e-05 -Inf
#>
#> $keep_lows
#> auc auc_var_H0 rzAUC pval_asym threshold
#> 1 0.2584 0.003366667 -4.163867 3.129021e-05 Inf
#>
#> $max_total
#> auc auc_var_H0 rzAUC pval_asym threshold part
#> 1 0.2584 0.003366667 -4.163867 3.129021e-05 -Inf global
#>
#> $positive_label
#> [1] "dist_2"
#>
#> $pROC_full
#>
#> Call:
#> roc.default(response = true_pred_df[["true"]], predictor = true_pred_df[["pred"]], levels = c(FALSE, TRUE), direction = direction)
#>
#> Data: true_pred_df[["pred"]] in 50 controls (true_pred_df[["true"]] FALSE) < 50 cases (true_pred_df[["true"]] TRUE).
#> Area under the curve: 0.2584
#>
#> attr(,"class")
#> [1] "restrictedROC" "list"
#>
tmp <- simple_rROC(
response = melt_gendata(sim_samples)[["Distribution"]],
predictor = melt_gendata(sim_samples)[["Value"]],
direction = "<",
positive_label = "dist_1",
return_proc = TRUE
)
single_rROC <- simple_rROC_interpret(tmp)
plot_density_rROC_empirical(sim_samples, single_rROC = single_rROC)
#> $plots
#> Ignoring unknown labels:
#> • colour : ""
#>
#> $single_rROC
#> $performances
#> # A tibble: 101 × 21
#> threshold auc_high positives_high negatives_high scaling_high auc_var_H0_high
#> <dbl> <dbl> <dbl> <dbl> <dbl> <dbl>
#> 1 -Inf 0.258 50 50 1 0.00337
#> 2 -2.35 0.264 49 50 1.02 0.00340
#> 3 -2.05 0.269 48 50 1.04 0.00344
#> 4 -1.61 0.275 47 50 1.06 0.00348
#> 5 -1.34 0.281 46 50 1.09 0.00351
#> 6 -1.31 0.287 45 50 1.11 0.00356
#> 7 -1.21 0.294 44 50 1.14 0.00360
#> 8 -1.12 0.300 43 50 1.16 0.00364
#> 9 -1.07 0.308 42 50 1.19 0.00369
#> 10 -1.05 0.315 41 50 1.22 0.00374
#> # ℹ 91 more rows
#> # ℹ 15 more variables: rzAUC_high <dbl>, pval_asym_onesided_high <dbl>,
#> # pval_asym_high <dbl>, auc_low <dbl>, positives_low <dbl>,
#> # negatives_low <dbl>, scaling_low <dbl>, auc_var_H0_low <dbl>,
#> # rzAUC_low <dbl>, pval_asym_onesided_low <dbl>, pval_asym_low <dbl>,
#> # tp <dbl>, fp <dbl>, tpr_global <dbl>, fpr_global <dbl>
#>
#> $global
#> auc auc_var_H0 rzAUC pval_asym
#> 1 0.2584 0.2584 -4.163867 3.129021e-05
#>
#> $keep_highs
#> auc auc_var_H0 rzAUC pval_asym threshold
#> 1 0.2584 0.003366667 -4.163867 3.129021e-05 -Inf
#>
#> $keep_lows
#> auc auc_var_H0 rzAUC pval_asym threshold
#> 1 0.2584 0.003366667 -4.163867 3.129021e-05 Inf
#>
#> $max_total
#> auc auc_var_H0 rzAUC pval_asym threshold part
#> 1 0.2584 0.003366667 -4.163867 3.129021e-05 -Inf global
#>
#> $positive_label
#> [1] "dist_2"
#>
#> $pROC_full
#>
#> Call:
#> roc.default(response = true_pred_df[["true"]], predictor = true_pred_df[["pred"]], levels = c(FALSE, TRUE), direction = direction)
#>
#> Data: true_pred_df[["pred"]] in 50 controls (true_pred_df[["true"]] FALSE) < 50 cases (true_pred_df[["true"]] TRUE).
#> Area under the curve: 0.2584
#>
#> attr(,"class")
#> [1] "restrictedROC" "list"
#>
tmp <- simple_rROC(
response = melt_gendata(sim_samples)[["Distribution"]],
predictor = melt_gendata(sim_samples)[["Value"]],
direction = "<",
positive_label = "dist_1",
return_proc = TRUE
)
single_rROC <- simple_rROC_interpret(tmp)
plot_density_rROC_empirical(sim_samples, single_rROC = single_rROC)
#> $plots
#> Ignoring unknown labels:
#> • colour : ""
 #>
#> $single_rROC
#> $performances
#> # A tibble: 101 × 21
#> threshold auc_high positives_high negatives_high scaling_high auc_var_H0_high
#> <dbl> <dbl> <dbl> <dbl> <dbl> <dbl>
#> 1 -Inf 0.742 50 50 1 0.00337
#> 2 -2.35 0.736 50 49 1.02 0.00340
#> 3 -2.05 0.731 50 48 1.04 0.00344
#> 4 -1.61 0.725 50 47 1.06 0.00348
#> 5 -1.34 0.719 50 46 1.09 0.00351
#> 6 -1.31 0.713 50 45 1.11 0.00356
#> 7 -1.21 0.706 50 44 1.14 0.00360
#> 8 -1.12 0.700 50 43 1.16 0.00364
#> 9 -1.07 0.692 50 42 1.19 0.00369
#> 10 -1.05 0.685 50 41 1.22 0.00374
#> # ℹ 91 more rows
#> # ℹ 15 more variables: rzAUC_high <dbl>, pval_asym_onesided_high <dbl>,
#> # pval_asym_high <dbl>, auc_low <dbl>, positives_low <dbl>,
#> # negatives_low <dbl>, scaling_low <dbl>, auc_var_H0_low <dbl>,
#> # rzAUC_low <dbl>, pval_asym_onesided_low <dbl>, pval_asym_low <dbl>,
#> # tp <dbl>, fp <dbl>, tpr_global <dbl>, fpr_global <dbl>
#>
#> $global
#> auc auc_var_H0 rzAUC pval_asym
#> 1 0.7416 0.7416 4.163867 3.129021e-05
#>
#> $keep_highs
#> auc auc_var_H0 rzAUC pval_asym threshold
#> 1 0.7416 0.003366667 4.163867 3.129021e-05 -Inf
#>
#> $keep_lows
#> auc auc_var_H0 rzAUC pval_asym threshold
#> 1 0.7416 0.003366667 4.163867 3.129021e-05 Inf
#>
#> $max_total
#> auc auc_var_H0 rzAUC pval_asym threshold part
#> 1 0.7416 0.003366667 4.163867 3.129021e-05 -Inf global
#>
#> $positive_label
#> [1] "dist_1"
#>
#> $pROC_full
#>
#> Call:
#> roc.default(response = true_pred_df[["true"]], predictor = true_pred_df[["pred"]], levels = c(FALSE, TRUE), direction = direction)
#>
#> Data: true_pred_df[["pred"]] in 50 controls (true_pred_df[["true"]] FALSE) < 50 cases (true_pred_df[["true"]] TRUE).
#> Area under the curve: 0.7416
#>
#> attr(,"class")
#> [1] "restrictedROC" "list"
#>
#>
#> $single_rROC
#> $performances
#> # A tibble: 101 × 21
#> threshold auc_high positives_high negatives_high scaling_high auc_var_H0_high
#> <dbl> <dbl> <dbl> <dbl> <dbl> <dbl>
#> 1 -Inf 0.742 50 50 1 0.00337
#> 2 -2.35 0.736 50 49 1.02 0.00340
#> 3 -2.05 0.731 50 48 1.04 0.00344
#> 4 -1.61 0.725 50 47 1.06 0.00348
#> 5 -1.34 0.719 50 46 1.09 0.00351
#> 6 -1.31 0.713 50 45 1.11 0.00356
#> 7 -1.21 0.706 50 44 1.14 0.00360
#> 8 -1.12 0.700 50 43 1.16 0.00364
#> 9 -1.07 0.692 50 42 1.19 0.00369
#> 10 -1.05 0.685 50 41 1.22 0.00374
#> # ℹ 91 more rows
#> # ℹ 15 more variables: rzAUC_high <dbl>, pval_asym_onesided_high <dbl>,
#> # pval_asym_high <dbl>, auc_low <dbl>, positives_low <dbl>,
#> # negatives_low <dbl>, scaling_low <dbl>, auc_var_H0_low <dbl>,
#> # rzAUC_low <dbl>, pval_asym_onesided_low <dbl>, pval_asym_low <dbl>,
#> # tp <dbl>, fp <dbl>, tpr_global <dbl>, fpr_global <dbl>
#>
#> $global
#> auc auc_var_H0 rzAUC pval_asym
#> 1 0.7416 0.7416 4.163867 3.129021e-05
#>
#> $keep_highs
#> auc auc_var_H0 rzAUC pval_asym threshold
#> 1 0.7416 0.003366667 4.163867 3.129021e-05 -Inf
#>
#> $keep_lows
#> auc auc_var_H0 rzAUC pval_asym threshold
#> 1 0.7416 0.003366667 4.163867 3.129021e-05 Inf
#>
#> $max_total
#> auc auc_var_H0 rzAUC pval_asym threshold part
#> 1 0.7416 0.003366667 4.163867 3.129021e-05 -Inf global
#>
#> $positive_label
#> [1] "dist_1"
#>
#> $pROC_full
#>
#> Call:
#> roc.default(response = true_pred_df[["true"]], predictor = true_pred_df[["pred"]], levels = c(FALSE, TRUE), direction = direction)
#>
#> Data: true_pred_df[["pred"]] in 50 controls (true_pred_df[["true"]] FALSE) < 50 cases (true_pred_df[["true"]] TRUE).
#> Area under the curve: 0.7416
#>
#> attr(,"class")
#> [1] "restrictedROC" "list"
#>